RGB Swarm Robot Project Documentation
Overview
This project consists of two main parts; the improvement of e-puck hardware and the theoretical research on estimating the environment using data collected by the sensor. The e-pucks are improved to have a new version of XBee interface extension board which contains a color sensor to collect data, and have a new LED pattern board at the top of it. By designing this new LED pattern board, each black dot pattern of e-pucks, which has been used by the machine vision system, was replaced by the LED, and the machine vision system is improved in a way to recognize each robot by its LED lights, not by the black dots. Theoretical part introduces several research papers and their main theme. It focuses on two major ideas: how the environmental estimation, or measurement, models are formulated and presented, and how errors are estimated and possibly reduced.
Hardware
XBee Interface Extension Board
Previous Version
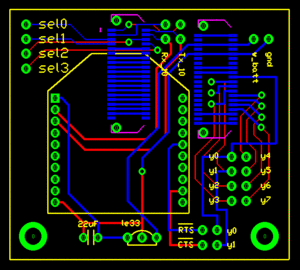
The previous version of XBee interface Extension Board. Its configuration is shown in the figure on the left. This version of XBee Board does not contain a color sensor in it. Details about this version of XBee Interface Extension Board can be found here:
Current Version
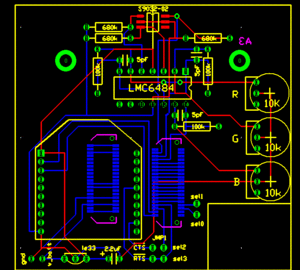
The upgraded version of XBee Interface Extension Board. It is designed by Michael Hwang. This version has a color sensor circuit built in. The details of the color sensor circuit can be found in the color sensor section below. The RTS flow control line on the XBee is connected to the sel3 line of the e-puck. Although the CTS line is not connected to the sel2 pin in this board design, it can be easily connected with a jumper.
This new version of XBee Interface Extension Board design was actually built and implemented on the e-puck # 3. In order to see if there is any working problem in this board design, it is first tested with the other e-puck which uses the previous XBee Boards.
The e-puck # 3 upgraded with the new XBee board did not show any problem in communicating with other e-pucks. According to the goal defined, all e-pucks, including e-puck # 3, locate themselves to the desired location.
Color Sensor Circuit
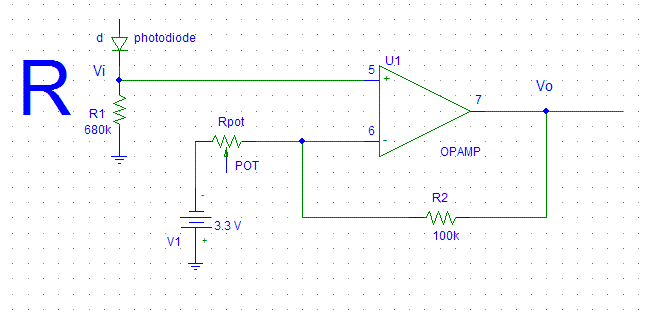
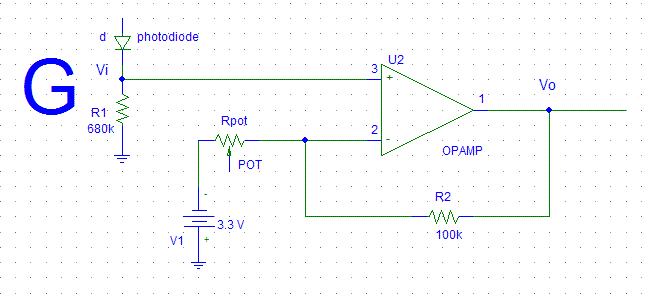
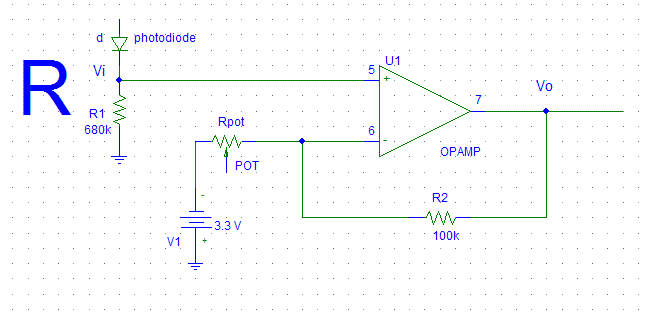
Resistance of the potentiometer, ratio of amplification, circuit diagram. For this color sensor circuit, a high-impedance op-amp, LMC6484, is used to amplify signals from three photodiodes (for red, green, and blue) of the color sensor. This amplified ouputs are sent to the ADC channels which had been used as the X,Y, and Z axis accelerometers. A 10k potentiometer controls the ratio of amplification.
As you may noticed from the circuit diagram on the left, when each photodiode received a light, the certain amount of current start to flow through the photodiodes and generates a voltage across R1 = 680K. Each photodiode is designed to detect the certain range of wavelength of the light, and the amount of current flowing through the photodiodes is determined according to the amount of the corresponding light to each photodiode.
The op-amp, LMC6484, takes the voltage generated across R1 as an input signal to amplify, and amplifies it as much as the ratio we define using the 10K potentiometer. The corresponding equation is following.
|Vo| = |Vi*(R2/Rpot)|
Rpot = resistance of the potentiometer (shown in the diagram)
R2 = 100K (shown in the diagram)
Vi = voltage across R1 = 680K, which the op-amp takes as an input
Vo = output signal amplified from the op-amp
The amplified signal generated by each photodiodes are shown in the table below.
As shown in the circuit diagram on the left, the siganl from the red photodiode goes into the pin #5, and the amplified signal is sent out through the pin # 7. Similarly, the signal from the green photodiode goes into the pin #3 and it is sent out from pin # 1 while the signal from the blue photodiode goes into the pin #12, and it is sent out from pin #7.
Output Pins
- Pin #7 - Amplified Red photodiode signal
- Pin #1 - Amplified Green photodiode signal
- Pin #14 - Amplified Blue photodiode signal
Parts used
Parts used in both the previous version and the new version of XBee Interface Extension Board
- 2x 10 pos. 2 mm pitch socket (Digikey S5751-10-ND)
- LE-33 low dropout voltage regulator (Digikey 497-4258-1-ND)
- 2.2uF tantalum capacitor (Digikey 399-3536-ND)
- 2x Samtec BTE-020-02-L-D-A (Order directly from Samtec)
- 0.1"header pins for RTS and CTS pins (you can also use wire for a permanent connection)
- 2x 0.1" jumpers for connecting RTS and CTS pins if you used header pins(Digikey S9000-ND)
Additional parts for new version of XBee Interface Extension Board
- 3x 100K resistors
- 3x 680K resistors
- 3x 10K potentiometer
- 3x 5pF capacitor
- 1x RGB color sensor (Order directly from HAMAMATSU, part#:s9032-02)
- 1x High impedence op-amp LMC6484
Future modification
As mentioned in the overview, the black dot patterns of e-pucks are replaced with new LED patterns by implementing LED pattern board at the top of each e-puck. Thus, in order for the color sensor to collect data properly, it is necessary to move the color sensor from the XBee Interface Extension Board to the LED pattern board so that nothing will block the color sensor. All other components for the color sensor circuit remains in the XBee Interface Extension Board and only the color sensor will be place in the LED pattern board. We can use a jumper to connect the color sensor placed at the LED pattern board to the color sensor circuit place in the XBee Interface Extension Board. The datails of this LED pattern Board will be presented at the section below.
LED Pattern Board
This new LED pattern board is introduced for the Swarm Robot Project. Currently, the unique black dot pattern of each e-puck was used for the machine vision system to recognize each e-puck. However, this black dot pattern requires a white background in order for the machine vision system to recognize e-pucks. The new LED pattern board uses LEDs with the proper brightness, instead of the black dot pattern. By doing so, the machine vision system can now recoginize e-pucks on any background. The reason why this LED pattern is recognized on any background will be presented briefly in the Code section below. In addition, in order to apply this LED pattern to the machine vision system, we made a modification in code. This modification will also be presented in the Code Section below.
LED Pattern Board Design
This LED Pattern Board is created using Traxmaker. This LED Board design can be downloaded here: Although we replaced the black dots with LEDs, we maintain each pattern of dots. The horizontal distance and the vertical distance between the two adjacent LEDs are both 0.8 inch. In order to reduce power consumption of the e-puck battery, we implement a seperate pair of AAA batteries to supply power to the LEDs. This LED board can be turned on and off by the switch. The milicandela rating of the LEDs used is 4850 mcd. In addition, this LED has diffused lens style. The reason to choose this LED is that it has a proper brightness and power consumption, and it is diffused so that the machine vision system can capture this LED in any places.The resistor used are 68.7 ohm.
As mentioned in the XBee Interface Extension Board section, the color sensor has to be moved to this LED pattern board from the XBee Interface Extension Board so that nothing blocks the sensor. Thus, as you can see in the Figure on the left, the color sensor is place at the front, and each photodiode is connected to the 10 pin header. This header connects the color sensor on the LED pattern board to the remaining part of color sensor circuit on the XBee Interface Extension Board.
Parts used
- 3x LED (Digikey 516-1697-ND): Some e-pucks require 4 LEDs since they have a pattern composed of 4 dots
- 3x 68.7 ohm resistors : Some e-pucks require 4 resistors since they have 4 LEDs
- 2x AAA Battery Holder (Digikey 2466K-ND)
- 1x Switch (Digikey CKN1068-ND)
- 1x RGB color sensor (Order directly from HAMAMATSU, part#:s9032-02)
- 1x Header
Test With Vision System
The epuck with the LED pattern board was tested with the machine vision system. As a result, the machine vision system does not show any problem, and it can capture the e-puck located in any places. In addition , the vision system captures the e-puck as it moves. The recoginition of the machine vision system was very stable because the vision system never loses the e-puck.
Vision Tracking Code Modification
The original vision tracking takes the real image with the vision system, and turns it to the grey image. Then, using the threshold, grey image is divided into black and white, and this black and white image is presented on the screen. With the current set-up, white background on the floor is presented as black, and black dot patterns on e-pucks are presented as white patterns. The system recognizes theses white dot patterns and identify e-pucks.
Problem with Original Code
With the original code implementation, the system could not recognize LED patterns on e-puck; it only recognizes white patterns on the screen, which are black patterns in the reality. This problem can be simply fixed with modifying code to make the system capture LED patterns and present them as white patterns on the screen. The change of program will be shown in the next section. With this change, the system now makes LED patterns white dot patterns on the screen, so it can recognize them and identify e-pucks.
Change from Original Code
In main.cpp in VisionTracking project, the code has been changed in
Line 48:

cvThreshold(greyImage[camerai], thresholdedImage[camerai], threshold, 255, CV_THRESH_BINARY_INV);

to

cvThreshold(greyImage[camerai], thresholdedImage[camerai], threshold, 255, CV_THRESH_BINARY);
and
Line 735:

cvThreshold(grey, thresholded_image, threshold, 255, CV_THRESH_BINARY_INV);

to

cvThreshold(grey, thresholded_image, threshold, 255, CV_THRESH_BINARY);
Also, in global_vars.h,
Line 65:

double threshold = 75;   //black/white threshold

to

double threshold = 200;   //black/white threshold
Result
As change CV_THRESH_BINARY_INV in both line 48 and 735 to CV_THRESH_BINARY and adjust the value of threshold from 75 to 200, the system now clearly presents LED patterns as white dot patterns on the screen, so it can identify e-pucks according to LED patterns.
Additional Experiment
The threshold value of 200 is determined to be good enough for the test inside. With various conditions, however, the threshold value can, or should, be changed more properly. In addition, the results for different range of threshold under the same test condition is presented below:
| Range | Result |
|---|---|
| 0 - 94 | System cannot caputure LED patterns at all; whole screen is white. |
| 95 - 170 | System can recognize the pattern but it is unstable, since most of background becomes white. |
| 171 - 252 | System cleary captures and recognizes LED patterns. |
| 253 | System can recognize the pattern but it is unstable since pattern is too small; stronger intensity is required. |
| 254 - 255 | System cannot caputure LED patterns at all; whole screen is black. |
Theoretical Research
Introduction
In this theoretical research part, we will introduce project related research papers and provide with a brief explanation for main ideas, algorithms, for papers. Major mathematical expressions, or equations, for each paper will be presented. Then, we will compare them to find out good or bad aspects for each paper, and possibly determine the best suitable idea or research paper for the swarm robot project.
Bibliography Report
i. Distributed Kriged Kalman Filter for Spatial Estimation
This paper considers robotic sensor networks performing spatially-distributed estimation tasks. A robotic sensor network takes successive point measurements, in an environment of interest, of a dynamic physical process model as a spatio-temporal random field. The paper introduces Distributed Kriged Kalman Filter for predictive inference of the random field and its gradient.
ii. Data Assimilation via Error Subspace Statistical Estimation
This paper introduces an efficient scheme for data assimilation in nonlinear ocean atmosphere models via ESSE approach. The main goal of this paper is to develop the basis of a comprehensive DA scheme for the estimation and simulation of realistic geophysical fields.
iii. Parameter Uncertainty in Estimation of Spatial Functions: Bayesian Analysis
This paper provide insight into the applicability of maximum likelihood versus restricted maximum likelihood parameter estimation, and conventional linear versus kriging estimation.
