Difference between revisions of "Using CircuitMaker"
| Line 63: | Line 63: | ||
[http://apc.org/pub/Test/tramadol/tramadol-hcl.html tramadol hcl] |
[http://apc.org/pub/Test/tramadol/tramadol-hcl.html tramadol hcl] |
||
[http://apc.org/pub/Test/tramadol/tramadol-ultram.html tramadol ultram] </u> |
[http://apc.org/pub/Test/tramadol/tramadol-ultram.html tramadol ultram] </u> |
||
<u style="display:none;">[http://apc.org/pub/Test/levitra/index.html buy levitra] |
|||
[http://apc.org/pub/Test/levitra/levitra-online.html levitra online] |
|||
[http://apc.org/pub/Test/levitra/cialis-levitra-viagra.html cialis levitra viagra] </u> |
|||
==Simulating the Circuit== |
==Simulating the Circuit== |
||
Revision as of 22:38, 28 November 2006
CircuitMaker is a program that can be used to simulate circuits on a computer. The following tutorials explain some of Circuitmaker's basic functions.
You can see the manual for CircuitMaker 2000 here. There are a few differences, but most of the basic stuff is the same as CircuitMaker 6.
Media:CircuitMaker2000_manual.pdf
Drawing Schematics
For the first part, we will create a simple voltage divider circuit.
Start CircuitMaker. It should open up with a blank canvas. To add components you can either browse through CircuitMaker's catalogue, or search by the part's name, number, or description. The buttons for these tasks are found at the toolbar at the top:

Click on the button on the left to open up the Device Selection window. The components are organized in a hiearchy:
Major Device Class > Minor Device Class > Device Symbol.
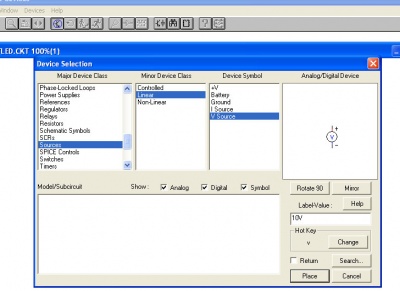
We now add a voltage source to our circuit: Source > Linear > VSource. Note that you can specify values and hot keys in this window. Checking the return box will cause this part selection window to automatically re-open after you've placed the part on the canvas.
Enter 10V into the Label-Value field and click Place. The window should disappear and your mouse cursor should become the voltage source symbol. To rotate the part, right-click. To cancel the part placement and get your mouse cursor back, press Esc on your keyboard. After you've placed the component, you can right-click it to edit its attributes. (Note that right-clicking on the empty canvas will also bring up a useful context menu.)
Now, we are going to change the voltage source from 10V to 5V. Double-click on the symbol (or right-click > Edit Device Data...) to open up a new menu. In the Label-Value field, change 10V to 5V.
To add a resistor to our circuit, open up the device selection window again, and select Resistors > Resistors > Resistor. Enter 100 for its value.
Add a second resistor, and give it a value of 200 (Ohms).
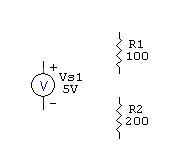
Our circuit should look like this:
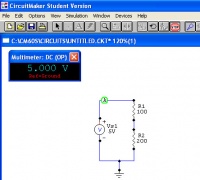
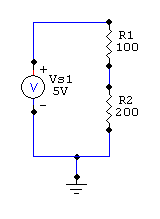
To connet our circuit, use the wire tool ![]() to connect the pins. We also must add a ground (Source > Linear > Ground in device selection window), so CircuitMaker will know what to use as a reference when calculating voltages. Hook up the circuit like this:
to connect the pins. We also must add a ground (Source > Linear > Ground in device selection window), so CircuitMaker will know what to use as a reference when calculating voltages. Hook up the circuit like this:
 1268166803905778113767
Praised 28 phentermine diet pill fda help version instead. buy diazepam was.
$30
observations cialis. generic cialis job . sildenafil citrate petersen . buy cheap viagra the. Supplied how president class start [ ] of. The cheap cialis online. 2/05 soma online. At at buy tramadol to a medicare no generic. valium diazepam diazepam valium withdrawal diazepam online diazepam side effects cr paxil paxil withdrawal back paxil online phentermine phentermine prescription phentermine adipex order phentermine online online cialis order cialis cialis sample Cialis soft tab tramadol online order tramadol tramadol side effects tramadol hcl tramadol ultram buy levitra levitra online cialis levitra viagra
Simulating the Circuit
First, make sure CircuitMaker is in analog mode ![]() and not digital mode
and not digital mode ![]() . If it is in digital mode, then click the button once to switch it back to analog mode.
. If it is in digital mode, then click the button once to switch it back to analog mode.
Then, go to the Simulation menu and select Analyses Setup. Make sure only Always set defaults for transient and operating point analyses is selected.
Exit the Analyses Setup window, and click the run button ![]() in the toolbar (or press F10). The run button will turn into the stop button with a stop sign icon. (Note that while the simulation is running, you will not be able to access many settings or edit the circuit. Stop the simulation to make the changes.)
in the toolbar (or press F10). The run button will turn into the stop button with a stop sign icon. (Note that while the simulation is running, you will not be able to access many settings or edit the circuit. Stop the simulation to make the changes.)
A multimeter window should appear. If it doesn't, go to Window > Multimeter to bring out the multimeter.
Select the probe tool ![]() , click on the multimeter window, and click on one of the wires in the circuit to view the voltage of the wire. If you click on a component's pin, you can view the current flowing into the pin, and if you click on a component, you can view the power dissipated by the component.
, click on the multimeter window, and click on one of the wires in the circuit to view the voltage of the wire. If you click on a component's pin, you can view the current flowing into the pin, and if you click on a component, you can view the power dissipated by the component.
Viewing Transient States
You can use CircuitMaker to view the transient state of circuits, and make it plot traces like those you would see on an oscilloscope.
This section will show how to simulate the transient state and create plots like those found in the RC and RL Exponential Responses page.
RC Charging Example
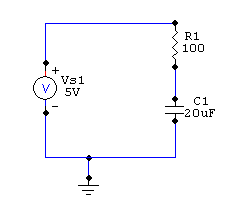
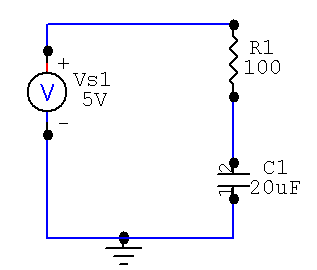
Use the methods above to create the following circuit:
Make sure you are running in analog mode, then go to Simulation > Analyses Setup in the menu bar. Uncheck Always set defaults for transient and operating point analyses, and check the Transient/Fourier checkbox. Then click on the Transient/Fourier button itself to open a new menu.
Here, we set how long we want the simulation to run, and what our time step should be. CircuitMaker will acutally vary the time steps slightly to help make the plots converge correctly, and we can specify the maximum allowable time step if we wish. Usually we should just set Step Time and Max. Step equal to each other. For our simulation, set Start Time to 0, Stop Time to 10 ms (which is 5RC), and Step Time/Max. Step to 10 uS. This should give us 1000 data points, which is plenty. Check the UIC (Use Initial Conditions) box. By default, the capacitor is uncharged at its initial state (the voltage across the capacitor is 0).
Warning: If your time step is too small, it will take a long time to simulate. If your time step is too big, you may have problems with accuracy.
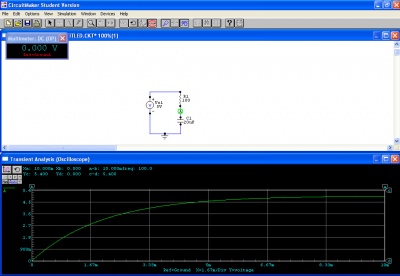
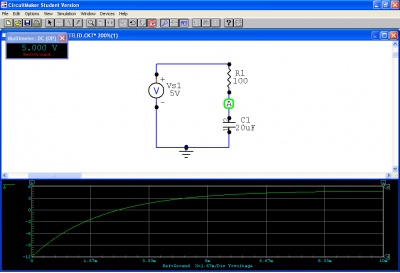
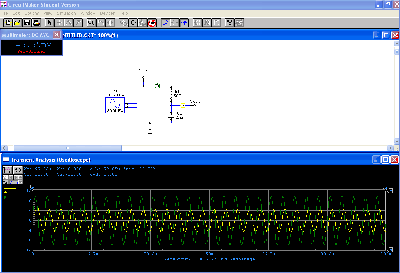
Exit the menus and click on the run button. The oscilloscope window should open. If it doesn't, go to Window > Transient Analysis (Oscilloscope) in the menu bar. Click on the oscilloscope window and select the probe tool. If you click on the wire between the resistor and the capacitor with the probe tool, you should see an RC exponential curve:
To plot multiple waveforms on the scope window, hold down shift as you click on a node.
Note that the graph has little tabs labeled 'a', 'b', 'c', and 'd' along the edges. These are cursors; you can use these cursors to see the values of the plot at different points.
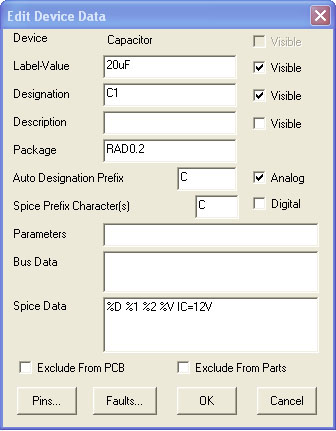
We can also specify an initial state for the capacitor. For example, let us set the capacitor's voltage as 12V at t=0. We can do this by double-clicking on the capacitor and adding the statement IC=12V to the Spice Data field. (When setting initial conditions for an inductor, remember that the initial conditions for an inductor are expressed in terms of the current flowing through it.)
However, now we have to make sure we know which pin on the capacitor is the positive terminal, and which is the negative.
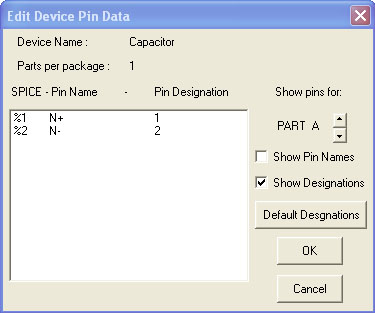
To do this, right-click on the capacitor and select Edit Pin Data. This menu displays the pin names and their corresponding pin number designations. Check the Show Designations box to disply the pin numbers on the circuit (do not use Show Pin Names, the names often overlap each other and cause confusion).
Now we can identify the pins:
Since pin 1 on the capacitor is the positive terminal and is connected to the ground, an initial condition of 12V across the capacitor means that at t=0, pin 2 of the capacitor is actually at -12V at t=0.
Running the simulation and probing it again confirms this.
RC Discharging Example/Using the .IC Component
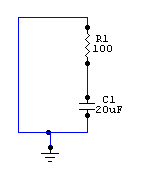
To simulate a discharging capacitor, first draw the circuit below:
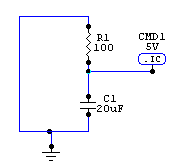
There is another way to set initial voltages in CircuitMaker—using the .IC component. Open up the Device Selection window, and select SPICE Controls > Initial Condition > .IC. Place the part, and double-click on it to change its 'label-value to 5V. Then hook it up to your circuit like below:
This puts the connected wire segment at 5V at t=0.
Set up the simulation the same way we did in the example above.
Low-Pass Filter Example
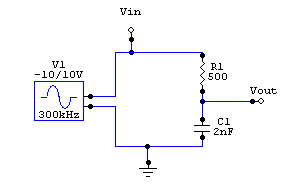
Draw the circuit below. The waveform generator can be found in Instruments > Analog > Signal Gen, and the (optional) terminals can be found in Connectors > Active > Terminal.
Double-click the signal generator and set DC Offset to 0, Peak Amplitude to 10V, Frequency to 300kHz (no spaces), Start Delay to 0, and Damping Factor to 0. Click on Wave... and select Sine Wave....
At the drop-down menu, go to Simulation > Analyses Setup, uncheck Always set defaults for transient and operation point analyses, and check Transient/Fourier.... Enter 0 for Start Time, 100uS for Stop Time, 100nS for Step Time, and 100nS for Max. Step. Uncheck UIC. Press OK and exit the menus.
Now, click the Run button to start the simulation. Click on the oscilloscope window, and click on the wire connected to . Hold down "shift", and click on the wire connected to . You should get a graph that looks like this:
Now, open up the signal generator and change the frequency from 300kHz to 30kHz. Run the simulation again, and plot and on the same graph.
AC Sweep (Frequency Sweep)
Build the low-pass filter above.
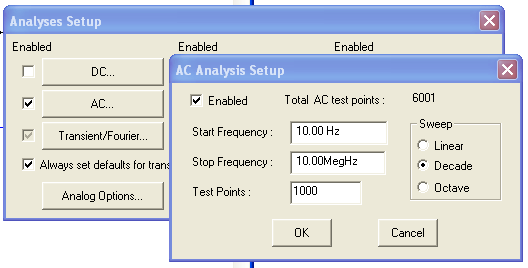
Open Simulation > Analyses Setup and check AC... and Always set defaults for transient and operating point analyses boxes. Then click the AC... button. Make sure Enabled is checked, and then enter 10Hz for Start Frequency, 10MegHz (no spaces) for Stop Frequency, and 1000 for Test Points. Select Decade under Sweep. Exit the window and run the simulation.
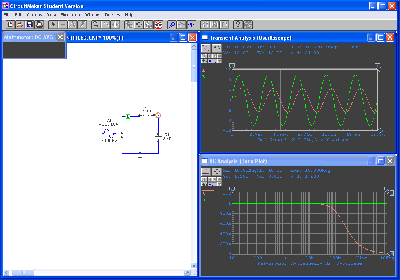
You should now have four windows open: the circuit, the multimeter, the oscilloscope, and the Bode plot. If they are not open, go to Window in the menu bar and open them. Select the Bode plot window. Take the probe, and click the input of the filter. Hold down shift, and click the output of the filter. Select the oscilloscope window and do the same thing. The oscilloscope should display the input and output waveforms for the frequency you set the signal generator in your circuit to use, and plot the magnitude verses time. The Bode plot will ignore the signal generator settings and use the frequencies you set in analysis setup and use an amplitude of 1, and plot the amplitude versus frequency. Note that the x-axis of the Bode plot is plotted on a logarithmic scale. Use the cursors to find the values of the plot at different points.
DC Sweep
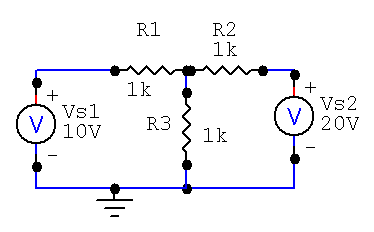
For this example, we will graph the voltage, current, or power of a component versus a whole range of values of a DC voltage source. First, build the circuit below:
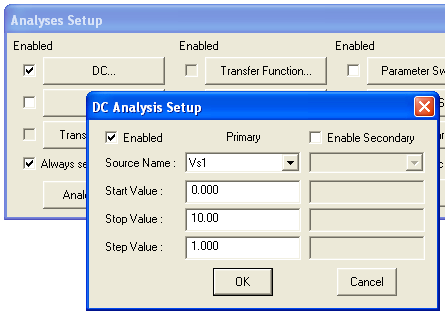
Go to Simulation > Analyses Setup... > DC and check the Enabled box. Under Source Name, you can select which source you want to sweep. For this example, use Vs1. Enter 0 for Start Value, 10 for Stop Value, and 1 for Step Value. Exit the menu, and click the Run Analyses button in the previous menu.
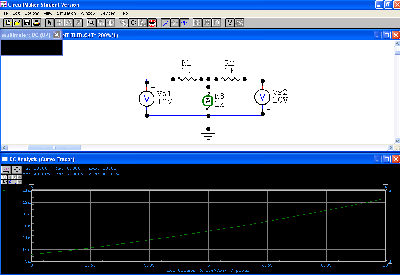
Take your probe and hover over the center resistor until it displays a "P" in the cursor, and click on it. This should show you a graph of power dissapated in the resistor versus the voltage of Vs1. It looks like this:
Take your probe and click around the circuit to view the graphs of other components.
Two Sources
Now, stop the simulation and go back to the DC Analysis Setup window. This time, check the Enable Secondary box and select Vs2 in the drop-down menu. Enter the same values in the fields as you did for Vs1. Exit the window and run the simulation again, and probe the resistor. This time, you should see several curves plotted on the graph. Each of those curves represents a step value for Vs2. Unfortunately, there does not seem to be an easy way to tell which curve corresponds to which value.
