Difference between revisions of "Test"
| (45 intermediate revisions by 2 users not shown) | |||
| Line 1: | Line 1: | ||
'''THIS PAGE APPEARS TO BE OUT OF DATE AND SHOULD PROBABLY BE ELIMINATED. See [[RGB Swarm Robot Project]].''' |
|||
== |
== Overview == |
||
The swarm robot project has gone through several phases, with each |
|||
Symbol for a diode: [[Image:diode_symbol.gif]] |
|||
phase focusing on different aspects of swarm robotics and the |
|||
implementation of the project. This entry focuses on the most recent |
|||
phase of the project, covering topics such as, but not limited to, |
|||
'''Xbee Interface Extension Boards''', '''LED light boards''', and |
|||
'''changes made to the Machine Vision Localization System''', and the |
|||
overall conversion to LED boards and a controlled light environment. |
|||
These entries help provide insight into setup and specific details to |
|||
allow others to replicate or reproduce our results, and to provide |
|||
additional information for those working on similar projects or this |
|||
project at a later time. Other articles in the '''Swarm Robot |
|||
Project''' category focus on topics such as the swarm theory and |
|||
algorithms implemented, as well as previous phases of the project, such |
|||
as motion control and consensus estimation. You may reach these |
|||
articles and others by following the category link at the bottom of |
|||
every page, or through this link - |
|||
[[:Category:SwarmRobotProject|'''Swarm Robot Project''']]. |
|||
== Hardware == |
|||
We can take advantage of the properties of a p-n junction to make a '''diode''', which is an electrical component that only allows current flow in one direction. A diode made of silicon needs about 0.7V across it in the forward direction ('''forward biased''') in order to conduct. At a large negative voltage ('''reverse biased'''), the diode fails and the current forces its way though. This is known as '''diode breakdown'''. |
|||
===XBee Interface Extension Board=== |
|||
[[Image:diode_N4002_profile.gif]] |
|||
{| |
|||
===Applications of Diodes=== |
|||
| |
|||
====Half-Wave Rectifier==== |
|||
[[Image:XBee_interface_extenstion_board_v1.gif|250px|thumb|alt=Traxmaker |
|||
A half-wave rectifier cuts off half of a sine wave, leaving only the positive or negative side (although not perfectly, because of the diode voltage drop). |
|||
Image of the Previous Xbee Extension Board|Previous Version]] |
|||
| [[Image:IMG 1390-1-.jpg|300px|thumb|alt=Image of an e-Puck with the |
|||
Xbee Extension Board|e-Puck with previous board ]] |
|||
| |
|||
[[Image:XBee_interface_extenstion_board_v2.gif|vertical|250px|thumb|alt=Traxmaker |
|||
Image of the Current Xbee Interface Exension Board|Current Version]] |
|||
| |
|||
|} |
|||
====Previous Version==== |
|||
The schematic for a simple rectifier: |
|||
The previous version of XBee Interface Extension Board, designed by |
|||
[[Image:half_wave_rectifier_schematic.gif]] |
|||
Michael Hwang. |
|||
Its configuration is shown in the figure on the left, with an actual |
|||
image of the board mounted on an e-Puck seen in the figure on the |
|||
right. This version of XBee Board does not contain a color sensor in |
|||
it. Details about this version of XBee Interface Extension Board, such |
|||
as parts used and Traxmaker files can be found on the |
|||
[[Swarm_Robot_Project_Documentation#Current_Version|Swarm Robot Project |
|||
Documentation page]]. |
|||
<br clear="all"> |
|||
====Current Version==== |
|||
The graph for half-wave rectifier: |
|||
[[Image:half_wave_rectifier_graph.gif]] |
|||
The upgraded version of XBee Interface Extension Board. It is designed |
|||
====Flyback Diode==== |
|||
by Michael Hwang. This version has a color sensor circuit built in. The |
|||
An approximate model of a DC motor is a resistor and inductor in series. (For more details on DC motors, see the section on [[Brushed_DC_Motor_Theory|brushed DC motors]].) If there is a current <math>i</math> through the motor, and we suddenly break the circuit by opening a switch, for instance, there will be a spike in the voltage across the inductor. This is because the current has to instantly go to zero (there is no longer a path for it), and the voltage across the inductor is proportional to the rate of change of current, |
|||
details of the color sensor circuit can be found in the color sensor |
|||
<math>v_L = L (di/dt)</math>. This may exhibit itself in a spark at the switch. A mechanical analog of instantly zeroing the current through an inductor is bringing the velocity of a moving mass to zero, instantly. |
|||
section below. |
|||
The RTS flow control line on the XBee is connected to the sel3 line of |
|||
To alleviate this problem, we can put a '''flyback diode''' across the motor terminals, as shown below: |
|||
the e-puck. Although the CTS line is not connected to the sel2 pin in |
|||
this board design, it can be easily connected with a jumper. |
|||
This new version of XBee Interface Extension Board design was actually |
|||
[[Image:diode_flyback_schematic.gif]] |
|||
built and implemented on the e-puck # 3. In order to see if there is |
|||
any working problem in this board design, it is first tested with the |
|||
other e-puck which uses the previous XBee Boards. |
|||
The e-puck # 3 upgraded with the new XBee board did not show any |
|||
This diode allows current to continue flowing through the motor, satisfying the inductor's "desire" to continue to allow current to flow. The energy in the inductor is dissipated over time by the resistance of the motor, and the current drops smoothly to zero. Note that no current flows through the diode when the switch is closed, as it is reverse biased. |
|||
problem in communicating with other e-pucks. According to the goal |
|||
defined, all e-pucks, including e-puck # 3, locate themselves to the |
|||
desired location. |
|||
<br clear="all"> |
|||
=====Color Sensor Circuit===== |
|||
{| |
|||
| [[Image:color_sensor_circuit_diagram_v1_R.gif|300px|thumb|Red Color |
|||
Sensor Circuit]] |
|||
| [[Image:color_sensor_circuit_diagram_v1_G.gif|315px|thumb|Green Color |
|||
Sensor Circuit]] |
|||
| [[Image:color_sensor_circuit_diagram_v1_B.gif|300px|thumb|Blue Color |
|||
Sensor Circuit]] |
|||
|} |
|||
As you may draw from the circuit diagrams above, as each photodiode |
|||
The flyback diode must be sufficiently large to carry the potentially large currents of the motor. |
|||
receives light, a certain amount of current start to flow through the |
|||
photodiodes and generates a voltage across R<sub>1</sub> = 680K. Each |
|||
photodiode is designed to detect the certain range of wavelength of the |
|||
light, and the amount of current flowing through the photodiodes is |
|||
determined according to the amount of the corresponding light to each |
|||
photodiode. The op-amp (LMC6484) takes the voltage generated across |
|||
R<sub>1</sub> as the input signal, amplifying it by a ratio particular |
|||
to the circuit. This ratio is also known as gain, and is defined by |
|||
resistance of the potentiometer. The now amplified output is then sent |
|||
to the analog digital converter, which on the e-Puck had been used as |
|||
the X,Y, and Z axis accelerometers. This convenient, as each |
|||
accelerometer axis can be used as a channel for the color sensors three |
|||
colors. The converted signal can then be used to measure the response |
|||
of the color sensor to light. The corresponding equation for the |
|||
circuits illustrated above are as follows: |
|||
<math>|V_o| = |V_i * \frac{R_2}{R_{pot}}|</math> |
|||
'''Question''': If the voltage supply is +10V relative to ground and the diode drop is 0.7V, what is the voltage across the inductor immediately after the switch is opened? Make sure you have the sign right, where positive voltage means the left side has a higher potential than the right side. (Remember, the voltage across an inductor can change discontinuously, but not the current, if there is any possible path for the current.) |
|||
*R<sub>pot</sub> = resistance of the potentiometer (shown in the |
|||
====Peak Detector==== |
|||
diagram) |
|||
We can make a peak detector if we hook up our circuit like this: |
|||
*R<sub>2</sub> = 100K (shown in the diagram) |
|||
*V<sub>i</sub> = voltage across R<sub>1</sub> = 680K, which the op-amp |
|||
takes as an input |
|||
*V<sub>o</sub> = output signal amplified from the op-amp |
|||
The gain of the color sensor circuits is approximately 20. Thus, the |
|||
[[Image:peak_detector_schematic.gif]] |
|||
input voltage, V<sub>i</sub>, is amplified to be 20V<sub>i</sub>, which |
|||
is V<sub>o</sub>. As mentioned above, the gain can be adjusted properly |
|||
by controlling the resistance of the potentiometer. |
|||
As shown in the circuit diagram on the left, the siganl from the red |
|||
The graph of the input and output voltages looks like this: |
|||
photodiode goes into the pin #5, and the amplified signal is sent out |
|||
through the pin # 7. Similarly, the signal from the green photodiode |
|||
goes into the pin #3 and it is sent out from pin #1 while the signal |
|||
from the blue photodiode goes into the pin #12, and it is sent out from |
|||
pin #14. |
|||
Output Pins |
|||
[[Image:peak_detector_graph.gif]] |
|||
*Pin #7 - Amplified Red photodiode signal |
|||
*Pin #1 - Amplified Green photodiode signal |
|||
*Pin #14 - Amplified Blue photodiode signal |
|||
=====Parts used===== |
|||
Each time the input voltage dips, the diode prevents the capacitor from draining. |
|||
Parts used in both the previous version and the new version of XBee |
|||
Interface Extension Board |
|||
*2x 10 pos. 2 mm pitch socket (Digikey S5751-10-ND) |
|||
*LE-33 low dropout voltage regulator (Digikey 497-4258-1-ND) |
|||
*2.2uF tantalum capacitor (Digikey 399-3536-ND) |
|||
*2x Samtec BTE-020-02-L-D-A (Order directly from Samtec) |
|||
*0.1"header pins for RTS and CTS pins (you can also use wire for a |
|||
permanent connection) |
|||
*2x 0.1" jumpers for connecting RTS and CTS pins if you used header |
|||
pins(Digikey S9000-ND) |
|||
Additional parts for new version of XBee Interface Extension Board |
|||
There are two problems with this circuit: First, the voltage at <math>V_{out}</math> is always one diode drop less than the maximum <math>V_{in}</math>. Second, the circuit has a very low impedance, and the capacitor drains a lot of current. A better peak detector can be built with op-amps. |
|||
*3x 100K resistors |
|||
*3x 680K resistors |
|||
====Voltage Clamp==== |
|||
*3x 10K potentiometer |
|||
A voltage clamp limits the output voltage, which is useful when we need to protect circuits from high voltages. We specify the maximum and minimum voltage we want by applying voltages across a diode. We must also take into account the voltage drop, so the voltages we apply should be <math>V_{max}-0.7</math> and <math>V_{min}+0.7</math> |
|||
*3x 5pF capacitor |
|||
*1x RGB color sensor (Order directly from HAMAMATSU, part#:s9032-02, |
|||
[[Image:diode_voltage_clamp.gif]] |
|||
[http://jp.hamamatsu.com/resources/products/ssd/pdf/s9032-02_kspd1067e03.pdf |
|||
Datasheet]) |
|||
In this circuit, if <math>V_{in}</math> exceeds <math>V_{max}</math>, diode <math>D_1</math> becomes forward biased and conducts, thus forcing <math>V_{out}</math> to stay at <math>V_{max}</math>. If <math>V_{in}</math> drops lower than <math>V_{min}</math>, diode <math>D_2</math> conducts and prevents the <math>V_{out}</math> from dropping any lower. |
|||
*1x High impedence op-amp LMC6484 |
|||
==Zener Diodes== |
|||
symbol for a zener diode:[[Image:zener_diode_symbol.gif]] |
|||
Zener diodes have a low breakdown voltage, or zener voltage, and can allow reverse current to flow without being destroyed. A good zener diode can also maintain a fairly constant voltage over a large range of currents. The voltage-current graph of a zener diode looks like this: |
|||
[[Image:zener_graph.gif]] |
|||
===Voltage Regulator=== |
|||
We can use a zener diode to build a voltage regulator like this: |
|||
[[Image:zener_voltage_regulator.gif]] |
|||
<math>V_{out}</math> is the '''reverse breakdown voltage''' or '''zener voltage'''. In the circuit, ''V'' is greater than ''V<sub>Z</sub>''. This voltage regulator can only step down the voltage, not up. |
|||
Even if the current through the diode fluctuates, the voltage remains fairly stable. Choose a resistance R large enough such that the power specs of the zener diode are not exceeded, but not so large that it limits our current too much. |
|||
For example, if our diode has a zener voltage of 5V and can handle 1W, and our voltage source has a maximum voltage of 20V: |
|||
The largest amount of current our diode ever has to handle is the current through the diode when there is no external load. Therefore: |
|||
<math>I_{z(max)}=\frac{(20-5)V}{R}</math> |
|||
<math>P=IV=I(5V)=\left(\frac{(20-5)V}{R}\right)(5V)=1W</math> |
|||
<math>R=\frac{(15V)(5V)}{1W}=75 \Omega</math> |
|||
This means that we need at least 75Ω to protect our diode. Keep in mind that we must meet the power ratings for our resistor as well. |
|||
Because current is flowing through the resistor and diode even when there is no load, power is being wasted. We can do better with voltage regulator chips like a 7805 chip (78xx for xx volts). |
|||
==LEDs (Light Emitting Diode)== |
|||
symbol for an LED: [[Image:LED_symbol.gif]] |
|||
An LED is a type of diode that emits visible or infrared light proportional to the current passing through it (up to a maximum before it burns out). |
|||
A typical LED shines its brightest between 5mA and 30mA. Beyond its rated current, it may burn out. |
|||
[[Image:LED_photo.jpg|thumb|right|A photograph of an LED]] |
|||
Notice that on the LED pictured at the right, one of the legs is longer. The longer leg is the positive terminal. However, do not rely on the length of the leg to determine the polarity, because you will probably snip the legs short later on. Instead, look at the side of the plastic lens, and notice that it's not perfectly round; one side is flattened. The flattened side is the ground. |
|||
[[Image:LED_inside_photo.jpg]]http://hades.mech.northwestern.edu/index.php?title=Diodes_and_Transistors&action=edit |
|||
=====Future modifications===== |
|||
As mentioned in the overview, the black dot patterns of e-pucks are |
|||
replaced with new LED patterns by implementing LED pattern board at the |
|||
top of each e-puck. Thus, in order for the color sensor to collect data |
|||
properly, it is necessary to move the color sensor from the XBee |
|||
Interface Extension Board to the LED pattern board so that nothing will |
|||
block the color sensor. All other components for the color sensor |
|||
circuit remains in the XBee Interface Extension Board and only the |
|||
color sensor will be place in the LED pattern board. We can use a |
|||
jumper to connect the color sensor placed at the LED pattern board to |
|||
the color sensor circuit place in the XBee Interface Extension Board. |
|||
The datails of this LED pattern Board will be presented at the section |
|||
below. |
|||
---- |
|||
===LED Pattern Board=== |
|||
[[Image:LED_pattern_board.gif|left|thumb]] |
|||
This new LED pattern board is introduced for the Swarm Robot Project. |
|||
Currently, the unique black dot pattern of each e-puck was used for |
|||
the machine vision system to recognize each e-puck. However, this black |
|||
dot pattern requires a white background in order for the machine vision |
|||
system to recognize e-pucks. The new LED pattern board uses LEDs with |
|||
the proper brightness, instead of the black dot pattern. By doing so, |
|||
the machine vision system can now recoginize e-pucks on any background. |
|||
The reason why this LED pattern is recognized on any background will be |
|||
presented briefly in the Code section below. In addition, in order to |
|||
apply this LED pattern to the machine vision system, we made a |
|||
modification in code. This modification will also be presented in the |
|||
Code Section below. The PCB file can be downloaded here: |
|||
[[Media:LED_Pattern_Board.pcb]] |
|||
<br clear="all"> |
<br clear="all"> |
||
====LED Pattern Board Design==== |
|||
This LED Pattern Board is created using Traxmaker. This LED Board |
|||
design can be downloaded here: |
|||
Although we replaced the black dots with LEDs, we maintain each pattern |
|||
of dots. The horizontal distance and the vertical distance between the |
|||
two adjacent LEDs are both 0.8 inch. In order to reduce power |
|||
consumption of the e-puck battery, we implement a seperate pair of AAA |
|||
batteries to supply power to the LEDs. This LED board can be turned on |
|||
and off by the switch. |
|||
The milicandela rating of the LEDs used is 4850 mcd. In addition, this |
|||
LED has diffused lens style. The reason to choose this LED is that it |
|||
has a proper brightness and power consumption, and it is diffused so |
|||
that the machine vision system can capture this LED in any places.The |
|||
resistor used are 68.7 ohm. |
|||
As mentioned in the XBee Interface Extension Board section, the color |
|||
==Photodiode== |
|||
sensor has to be moved to this LED pattern board from the XBee |
|||
Symbol for a photodiode:[[Image:photodiode_symbol.gif]] |
|||
Interface Extension Board so that nothing blocks the sensor. Thus, as |
|||
you can see in the Figure on the left, the color sensor is place at the |
|||
front, and each photodiode is connected to the 10 pin header. This |
|||
header connects the color sensor on the LED pattern board to the |
|||
remaining part of color sensor circuit on the XBee Interface Extension |
|||
Board. |
|||
====Parts used==== |
|||
Go to the [[Photodiodes_and_Phototransistors#Photodiodes|photodiode]] page for information on photodiodes. |
|||
*3x LED (Digikey 516-1697-ND): Some e-pucks require 4 LEDs since they |
|||
have a pattern composed of 4 dots |
|||
*3x 68.7 ohm resistors : Some e-pucks require 4 resistors since they |
|||
have 4 LEDs |
|||
*2x AAA Battery Holder (Digikey 2466K-ND) |
|||
*1x Switch (Digikey CKN1068-ND) |
|||
*1x RGB color sensor (Order directly from HAMAMATSU, part#:s9032-02) |
|||
*1x 10 pos. 2 mm pitch socket (Digikey S5751-10-ND) |
|||
====Tests==== |
|||
==Bipolar Junction Transistors (BJT)== |
|||
The symbols for transistors:[[Image:transistor_symbol.gif]] |
|||
=====LED Distance vs Color Sensor Signal===== |
|||
There are two types of of BJTs; n-p-n and p-n-p: |
|||
Tests need be done in order to note the affect of the LED light on the |
|||
color sensor due to potential interference. The first experiment |
|||
performed is designed to see how much interference will be caused as |
|||
the distance between the LED and the color sensor changes. |
|||
'''Setup and Results''' |
|||
<b><u>npn</u></b> |
|||
1. A white LED is used in this experiment because the white LED will |
|||
[[Image:npn_transistor_diagram.gif]] |
|||
cover the entire wavelengh ranges of the visible light. The experiment |
|||
with the white LED can yield a general result, while the experiment |
|||
with the colored LEDs will yield more specific result focused on the |
|||
interference between the certain photodiode and the certain color. |
|||
*LED: 18950 mcd (millicandela), digikey part number: |
|||
C503B-WAN-CABBB151-ND |
|||
2. The experiment was performed under the two conditions; with the |
|||
<b><u>pnp</u></b> |
|||
ambient light and without the ambient light. |
|||
3. The LED and the color sensor were placed at the same plane, and both |
|||
[[Image:pnp_transistor_diagram.gif]] |
|||
are facing upward. |
|||
4. Distance between the color sensor and the LED is increased by 0.25 |
|||
For the transistors, we have the following relationship for the voltages and curents: |
|||
inch each time from 1 inch to 2.5 inch. |
|||
5. The amplified output, V<sub>o</sub> as shown in the circuit diagram |
|||
<math>I_E=I_C+I_B</math> |
|||
above, of each photodiode is measured. |
|||
With Ambient light |
|||
<math>V_{BE}=V_B-V_E</math> |
|||
[[Image:Distance_vs_output_with_room_light.gif|450px|left|thumb]] |
|||
*Unit: Volt, V |
|||
{| class="wikitable" border="3" |
|||
<math>V_{CE}=V_C-V_E</math> |
|||
|+'''Distance vs Amplified Output''' |
|||
Under normal operation, ''BE'' is forward biased, and ''CB'' is reverse biased. |
|||
BJTs have three regions of operation: |
|||
Cutoff (<math>V_{BE}<0.6V</math>): <math>I_C=0</math> (no collector current) |
|||
Active(<math>V_{BE}</math>≈<math>0.6V</math>): <math>I_C=</math>''β''<math>I_B</math> (collector current is proportional to base current by factor ''β'', which is typically about 100) |
|||
Saturated(<math>V_{BE}</math>≈<math>0.7V</math>): <math>V_{CE}</math> ≈ <math>0.2V</math> (for npn); collector current is mainly limited by its subsequent circuitry. |
|||
===Applications of BJTs=== |
|||
====Common Emitter Amplifier Circuit==== |
|||
In a common emitter circuit, the emitter of a transistor is grounded and an input voltage is applied to the resistor at the base. An example common emitter circuit with a transistor (''β''=100) is drawn below: |
|||
[[Image:transistor_common_emitter.gif]] |
|||
If <math>V_{in}</math> < 0.7V (same as the diode drop), the p-n junction is not forward biased, there is no base current, and <math>I_C</math> is equal to 0. |
|||
If <math>V_{in}</math> > 0.7V, then |
|||
<math>I_B=(V_{in}-V_B)/10000</math>''Ω''<math>=(V_{in}-0.7)/10000</math>''Ω'' |
|||
<math>I_C=</math>''β''<math>(V_{in}-0.7)/10000</math>''Ω'' |
|||
Now we calculate how large <math>V_{in}</math> has to be to saturate the transistor. When <math>V_{CE}=0.2V</math>, the transistor becomes saturated. If the drop across the collector and emitter of the transistor is equal to 0.2V, then the drop across the resistor at the collector must equal 9.8V. Thus: |
|||
<math>I_C=9.8/1000</math>''Ω''<math>=9.8mA</math> |
|||
<math>I_B=I_C/</math>''β''<math>=0.098mA</math> |
|||
Then we find <math>V_{in}</math>: |
|||
<math>V_{in}-0.7=(0.098mA)(10000</math>''Ω''<math>)</math> |
|||
<math>V_{in}=1.68V</math> or greater. |
|||
'''cutoff''':<math>V_{in}</math> < 0.7V |
|||
'''active''':0.7V < <math>V_{in}</math> <1.68V |
|||
'''saturated''':1.68V < <math>V_{in}</math> |
|||
If we are using the transistor as a switch, we should fully saturate it to save power and reduce heat. |
|||
====Emitter Follower==== |
|||
The emitter follower is a very simple current amplifier, taking advantage of the fact that <math>I_C=</math>''β''<math>I_B</math>. The high input impedance means that our imput signal does not need to "work" as hard. |
|||
[[Image:transistor_emitter_follower.gif]] |
|||
<math>V_E=V_{in}-0.7V</math> |
|||
====Push-Pull Follower==== |
|||
If we put two emitter followers together (npn transistor for positive voltages; pnp transistor for negative voltages), we get a push-pull follower. |
|||
[[Image:transistor_push_pull_follower.gif]] |
|||
If <math>V_{in}</math> > 0.7V, then the current is amplified by the npn transistor. |
|||
If <math>V_{in}</math> < -0.7V, then the current is amplified by the pnp transistor. |
|||
Beware that there is a “dead band” when V<sub>in</sub> is between 0.7V and -0.7V, because the voltage has not pass the cutoff voltage for either transistor. This is known as '''crossover distortion'''. |
|||
=====Push-Pull Follower Example: A (Poor) Motor Speed Controller===== |
|||
Suppose we want to control the speed of a motor by varying the input voltage between +5V and -5V. We attempt to do this by setting put a voltage divider with a potentiometer like in the circuit below. |
|||
[[Image:speed_controller_simple.gif]] |
|||
We model our motor with a simple resistor <math>R_L</math>. If <math>R_L</math> is infinitely large (no current flowing through), then there will be a 7.2V drop across <math>R_1</math> and <math>R_3</math>, and <math>V_{in}</math> can take a value between 4.8V and -4.8V. |
|||
For the maximum voltage case (we turn the POT all the way to one side), our circuit with voltage sources looks like this: |
|||
[[Image:speed_controller_sources.gif]] |
|||
We know that <math>R_L</math> is ''not'' infinitely large because motors can draw quite a lot of current. If <math>R_L=0</math> (short circuit), then the <math>V_{in}=0V</math>. We can expect <math>V_{in}</math> to be somewhere between 0V and 4.8V. |
|||
We can solve the circuit with the following equations: |
|||
KCL: |
|||
<math>I_1=I_2+I_3</math> |
|||
KVL: |
|||
<math>12-750I_1-R_LI_2=0</math> |
|||
<math>12+R_LI_2-1750I_3=0</math> |
|||
<math>V_{in}=I_2R_L</math> |
|||
Solving the equations yields: |
|||
<math>V_{in}=24R_L/(2625+5R_L)</math> |
|||
If <math>R_L=10</math>Ω, we can plug it in and find that <math>V_{in}</math> is only equal to 0.0897V and the current is equal to 8.97mA—not nearly enough to drive the motor. |
|||
It turns out that the voltage controlling circuit cannot supply much current, so the low impedance of the motor drains what current is available very quickly and pulls down the output voltage. When the impedance of the power source is much larger than the impedance of the load, this is known as '''loading'''. |
|||
We can't use this circuit to drive a motor directly, because our controller needs to see a high impedance, but our motor has a low impedance—we need a way to isolate the controller from the motor. This is where we can use our push-pull current amplifier. We connect it to our circuit as shown below to better isolate the controller from the motor and amplify the current. Unfortunately, the transistors only have a gain of about 100, so the controller circuit still does not see an infinite impedance. |
|||
[[Image:speed_controller_push_pull.gif]] |
|||
====Emitter Follower Voltage Regulator==== |
|||
With our previous voltage regulator with the zener diode, we had the problems of the zener diode wasting power and needing a high power diode if there was a lot of current going through the diode. If we add an emitter-follower, we can use a much smaller diode and less current to achieve the same effect. |
|||
[[Image:emitter_follower_voltage_regulator.gif]] |
|||
====Darlington Pair==== |
|||
If we need a very high current gain, we replace a transistor with a ''Darlington pair''. The current gain is now: |
|||
<math>\beta=\beta_1\beta_2</math> |
|||
[[Image:Darlington_pairs.gif]] |
|||
==Field Effect Transistors (FET)== |
|||
FETs are a type of transistor that uses a voltage input to control its conductivity (as opposed to using the current like a BJT). The input impedance is very high and thus draws very little current. There are three general types of FETs: |
|||
1.enhancement mode metal-oxide-semiconductor FETs (MOSFETs) |
|||
2.depletion mode MOSFETs |
|||
3.Junction FETs (JFETs) |
|||
===MOSFETs=== |
|||
The symbol for a MOSFET looks like this: [[Image:mosfet_with_b_symbol.gif]] |
|||
where G is for '''gate''', S for '''source''', D for '''drain''', and B for '''substrate'''. |
|||
However, since B is usually connected to S, the symbol is often simply drawn as: [[Image:mosfet_without_b_symbol.gif]] |
|||
Electrons flow from the source to the drain, so the current flows from drain to source. The gate receives the input voltage. The gate pin is offset towards to source pin to help is differentiate between the source and drain pins. |
|||
MOSFETS come in '''enhancement''' and '''depletion''' modes. An enhancement mode MOSFET allows a current to flow only if a positive voltage is applied, while depletion mode MOSFETs allows a current to flow even if no voltage difference is applied. Increasing the voltage increases the current, and it takes a ''negative'' voltage to turn off a depletion mode MOSFET. MOSFETS, like BJTs, also come in ''p'' and ''n'' types. The different MOSFETS and their corresponding symbols are below: |
|||
{| border="1" cellspacing="0" cellpadding="5" align="center" |
|||
|+'''MOSFETS''' |
|||
|- |
|- |
||
! !! |
! Distance !! R !! G !! B |
||
|- |
|- |
||
| No LED|| 1 || 1.4 || 0.469 |
|||
!Enhancement!! [[Image:MOSFET_n_enhance.gif]] || [[Image:MOSFET_p_enhance.gif]] |
|||
|- |
|- |
||
| 1 inch || 1.259 || 1.716 || 0.832 |
|||
!Depletion!! [[Image:MOSFET_n_deplete.gif]] || [[Image:MOSFET_p_deplete.gif]] |
|||
|- |
|- |
||
| 1.25 inch || 1.185 || 1.619 || 0.757 |
|||
|- |
|||
| 1.5 inch || 1.135 || 1.529 || 0.669 |
|||
|- |
|||
| 1.75 inch || 1.097 || 1.503 || 0.613 |
|||
|- |
|||
| 2 inch || 1.086 || 1.481 || 0.589 |
|||
|- |
|||
| 2.25 inch || 1.071 || 1.47 || 0.563 |
|||
|- |
|||
| 2.5 inch || 1.06 || 1.453 || 0.546 |
|||
|} |
|} |
||
<br clear="all"> |
|||
Without the Ambient Light |
|||
[[Image:Distance_vs_output_without_room_light.jpg|450px|left|thumb]] |
|||
*Unit: Volt, V |
|||
{| class="wikitable" border="3" |
|||
===JFETs=== |
|||
|+'''Distance vs Amplified Output''' |
|||
JFETs are very similar to MOSFETS, but they only come in the depletion-mode variety. JFET consume little power, so they are often found in low-power applications. The symbols for JFETs are below: |
|||
|- |
|||
! Distance !! R !! G !! B |
|||
{| border="1" cellspacing="0" cellpadding="5" align="center" |
|||
|+'''MOSFETS''' |
|||
|- |
|- |
||
| No LED|| 0.028 || 0.025 || 0.019 |
|||
! !!n-channel!! p-channel |
|||
|- |
|- |
||
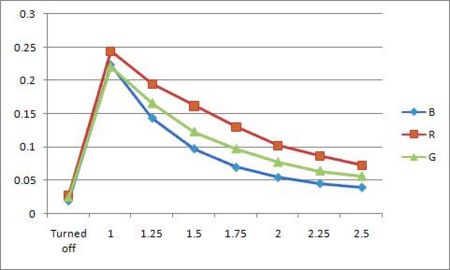
| 1 inch || 0.244 || 0.221 || 0.223 |
|||
! Depletion!! [[Image:JFET_n.gif]] || [[Image:JFET_p.gif]] |
|||
|- |
|- |
||
| 1.25 inch || 0.195 || 0.166 || 0.143 |
|||
|- |
|||
| 1.5 inch || 0.162 || 0.123 || 0.097 |
|||
|- |
|||
| 1.75 inch || 0.130 || 0.097 || 0.069 |
|||
|- |
|||
| 2 inch || 0.102 || 0.077 || 0.054 |
|||
|- |
|||
| 2.25 inch || 0.087 || 0.064 || 0.045 |
|||
|- |
|||
| 2.5 inch || 0.073 || 0.056 || 0.039 |
|||
|} |
|} |
||
<br clear="all"> |
|||
As you can see in the two graphs above, the color sensor is affected by |
|||
the light from the LED. The color sensor is most affectd by the LED |
|||
when the LED is closest to it. As the distance between the LED and the |
|||
color sensor increases, the interference decreases. When the color |
|||
sensor is most affected by the LED under the presence of the room |
|||
light, the output increases up to 25.9%, 22.6%, and 43.6 % of the |
|||
original output. As the LED is 2.5 inch away from the color sensor, the |
|||
output becomes very close to the original value. |
|||
In this experiment, we see that the lights from LEDs can affect the |
|||
color sensor. However, we used much brighter LED in this experiment |
|||
than the ones we use in the LED pattern board. The brightness of the |
|||
LED used in the experiment is 4 times larger than the ones in the LED |
|||
pattern board. Thus, more experiment with the LEDs used in the LED |
|||
pattern board is required. |
|||
=====LED Angle vs Color Sensor Signal===== |
|||
==Phototransistor== |
|||
Symbol for a phototransistor:[[Image:photo_transistor_symbol.gif]] |
|||
Notice that the phototransistor only has two legs. |
|||
The collector current of a phototransistor is proportional to the light or infrared light received. |
|||
[[Image:photo_transistor_diagram.gif]] |
|||
<math>V_{out}</math> can take a value between ''0V'' and <math>V_s-0.2V</math>. |
|||
The second experiment is designed to see how much interference will be |
|||
Go to the [[Photodiodes_and_Phototransistors#Phototransistors|phototransistor]] page for more information on phototransistors. |
|||
caused as the angle between LED and color sensor changes. Different |
|||
from the first experiment, V<sub>i</sub>, the voltage before amplified, |
|||
is mesured since amplified output, V<sub>o</sub>, easily reaches to the |
|||
maximum. |
|||
'''Setup and Results''' |
|||
Emitter/Detector pair: |
|||
1. A white LED is used again in this experiment with the same reason |
|||
[[Image:emitter_detector_pair.gif]] |
|||
above for the first experiment. |
|||
*LED: 18950 mcd, Digikey part number: C503B-WAN-CABBB151-ND |
|||
2. The experiment was performed under the two conditions; with the |
|||
An emitter-detector pair is a very useful circuit that can be used to isolate two circuits or used as a sensor. Among other applications, it can be used to detect changes in the distance between the emitter and detector (changing the distance changes the intensity of the received light) or used to detect interruptions in the light beam. |
|||
ambient light and without the ambient light. |
|||
3. In this experiment, the distance between LED and color sensor is |
|||
A [[Photodiodes_and_Phototransistors#Photodiodes|photodiode]] can also be used instead of a phototransistor in many applications; a photodiode cannot supply as much current, but has a faster response time. |
|||
kept constant, 1 inch. |
|||
4. Angle between LED and color sensor is increased by 15 |
|||
==References== |
|||
Alciatore, David G. and Michael B. Histand. <u>Introduction to Mechatronics and Measurement Systems</u>. 2nd ed. New York, NY:McGraw-Hill, 2003. |
|||
Latest revision as of 14:25, 17 April 2010
THIS PAGE APPEARS TO BE OUT OF DATE AND SHOULD PROBABLY BE ELIMINATED. See RGB Swarm Robot Project.
Overview
The swarm robot project has gone through several phases, with each phase focusing on different aspects of swarm robotics and the implementation of the project. This entry focuses on the most recent phase of the project, covering topics such as, but not limited to, Xbee Interface Extension Boards, LED light boards, and changes made to the Machine Vision Localization System, and the overall conversion to LED boards and a controlled light environment. These entries help provide insight into setup and specific details to allow others to replicate or reproduce our results, and to provide additional information for those working on similar projects or this project at a later time. Other articles in the Swarm Robot Project category focus on topics such as the swarm theory and algorithms implemented, as well as previous phases of the project, such as motion control and consensus estimation. You may reach these articles and others by following the category link at the bottom of every page, or through this link - Swarm Robot Project.
Hardware
XBee Interface Extension Board
Previous Version
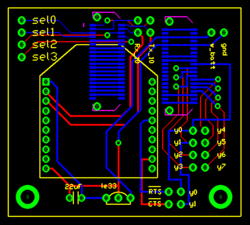
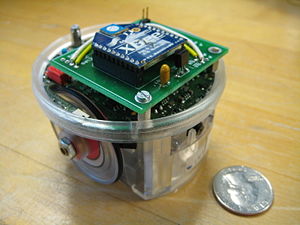
The previous version of XBee Interface Extension Board, designed by
Michael Hwang.
Its configuration is shown in the figure on the left, with an actual
image of the board mounted on an e-Puck seen in the figure on the
right. This version of XBee Board does not contain a color sensor in
it. Details about this version of XBee Interface Extension Board, such
as parts used and Traxmaker files can be found on the
Swarm Robot Project
Documentation page.
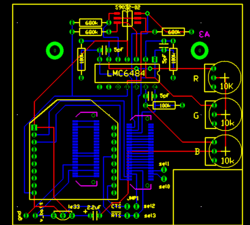
Current Version
The upgraded version of XBee Interface Extension Board. It is designed by Michael Hwang. This version has a color sensor circuit built in. The details of the color sensor circuit can be found in the color sensor section below.
The RTS flow control line on the XBee is connected to the sel3 line of the e-puck. Although the CTS line is not connected to the sel2 pin in this board design, it can be easily connected with a jumper.
This new version of XBee Interface Extension Board design was actually built and implemented on the e-puck # 3. In order to see if there is any working problem in this board design, it is first tested with the other e-puck which uses the previous XBee Boards.
The e-puck # 3 upgraded with the new XBee board did not show any
problem in communicating with other e-pucks. According to the goal
defined, all e-pucks, including e-puck # 3, locate themselves to the
desired location.
Color Sensor Circuit
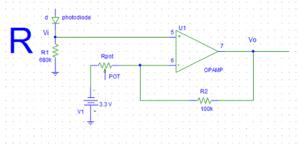
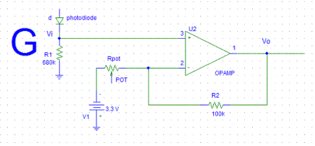
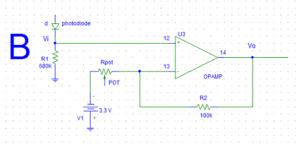
As you may draw from the circuit diagrams above, as each photodiode receives light, a certain amount of current start to flow through the photodiodes and generates a voltage across R1 = 680K. Each photodiode is designed to detect the certain range of wavelength of the light, and the amount of current flowing through the photodiodes is determined according to the amount of the corresponding light to each photodiode. The op-amp (LMC6484) takes the voltage generated across R1 as the input signal, amplifying it by a ratio particular to the circuit. This ratio is also known as gain, and is defined by resistance of the potentiometer. The now amplified output is then sent to the analog digital converter, which on the e-Puck had been used as the X,Y, and Z axis accelerometers. This convenient, as each accelerometer axis can be used as a channel for the color sensors three colors. The converted signal can then be used to measure the response of the color sensor to light. The corresponding equation for the circuits illustrated above are as follows:
- Rpot = resistance of the potentiometer (shown in the
diagram)
- R2 = 100K (shown in the diagram)
- Vi = voltage across R1 = 680K, which the op-amp
takes as an input
- Vo = output signal amplified from the op-amp
The gain of the color sensor circuits is approximately 20. Thus, the input voltage, Vi, is amplified to be 20Vi, which is Vo. As mentioned above, the gain can be adjusted properly by controlling the resistance of the potentiometer.
As shown in the circuit diagram on the left, the siganl from the red photodiode goes into the pin #5, and the amplified signal is sent out through the pin # 7. Similarly, the signal from the green photodiode goes into the pin #3 and it is sent out from pin #1 while the signal from the blue photodiode goes into the pin #12, and it is sent out from pin #14.
Output Pins
- Pin #7 - Amplified Red photodiode signal
- Pin #1 - Amplified Green photodiode signal
- Pin #14 - Amplified Blue photodiode signal
Parts used
Parts used in both the previous version and the new version of XBee Interface Extension Board
- 2x 10 pos. 2 mm pitch socket (Digikey S5751-10-ND)
- LE-33 low dropout voltage regulator (Digikey 497-4258-1-ND)
- 2.2uF tantalum capacitor (Digikey 399-3536-ND)
- 2x Samtec BTE-020-02-L-D-A (Order directly from Samtec)
- 0.1"header pins for RTS and CTS pins (you can also use wire for a
permanent connection)
- 2x 0.1" jumpers for connecting RTS and CTS pins if you used header
pins(Digikey S9000-ND)
Additional parts for new version of XBee Interface Extension Board
- 3x 100K resistors
- 3x 680K resistors
- 3x 10K potentiometer
- 3x 5pF capacitor
- 1x RGB color sensor (Order directly from HAMAMATSU, part#:s9032-02,
[http://jp.hamamatsu.com/resources/products/ssd/pdf/s9032-02_kspd1067e03.pdf Datasheet])
- 1x High impedence op-amp LMC6484
Future modifications
As mentioned in the overview, the black dot patterns of e-pucks are replaced with new LED patterns by implementing LED pattern board at the top of each e-puck. Thus, in order for the color sensor to collect data properly, it is necessary to move the color sensor from the XBee Interface Extension Board to the LED pattern board so that nothing will block the color sensor. All other components for the color sensor circuit remains in the XBee Interface Extension Board and only the color sensor will be place in the LED pattern board. We can use a jumper to connect the color sensor placed at the LED pattern board to the color sensor circuit place in the XBee Interface Extension Board. The datails of this LED pattern Board will be presented at the section below.
LED Pattern Board
This new LED pattern board is introduced for the Swarm Robot Project.
Currently, the unique black dot pattern of each e-puck was used for
the machine vision system to recognize each e-puck. However, this black
dot pattern requires a white background in order for the machine vision
system to recognize e-pucks. The new LED pattern board uses LEDs with
the proper brightness, instead of the black dot pattern. By doing so,
the machine vision system can now recoginize e-pucks on any background.
The reason why this LED pattern is recognized on any background will be
presented briefly in the Code section below. In addition, in order to
apply this LED pattern to the machine vision system, we made a
modification in code. This modification will also be presented in the
Code Section below. The PCB file can be downloaded here:
Media:LED_Pattern_Board.pcb
LED Pattern Board Design
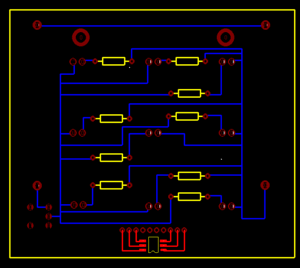
This LED Pattern Board is created using Traxmaker. This LED Board design can be downloaded here: Although we replaced the black dots with LEDs, we maintain each pattern of dots. The horizontal distance and the vertical distance between the two adjacent LEDs are both 0.8 inch. In order to reduce power consumption of the e-puck battery, we implement a seperate pair of AAA batteries to supply power to the LEDs. This LED board can be turned on and off by the switch. The milicandela rating of the LEDs used is 4850 mcd. In addition, this LED has diffused lens style. The reason to choose this LED is that it has a proper brightness and power consumption, and it is diffused so that the machine vision system can capture this LED in any places.The resistor used are 68.7 ohm.
As mentioned in the XBee Interface Extension Board section, the color sensor has to be moved to this LED pattern board from the XBee Interface Extension Board so that nothing blocks the sensor. Thus, as you can see in the Figure on the left, the color sensor is place at the front, and each photodiode is connected to the 10 pin header. This header connects the color sensor on the LED pattern board to the remaining part of color sensor circuit on the XBee Interface Extension Board.
Parts used
- 3x LED (Digikey 516-1697-ND): Some e-pucks require 4 LEDs since they
have a pattern composed of 4 dots
- 3x 68.7 ohm resistors : Some e-pucks require 4 resistors since they
have 4 LEDs
- 2x AAA Battery Holder (Digikey 2466K-ND)
- 1x Switch (Digikey CKN1068-ND)
- 1x RGB color sensor (Order directly from HAMAMATSU, part#:s9032-02)
- 1x 10 pos. 2 mm pitch socket (Digikey S5751-10-ND)
Tests
LED Distance vs Color Sensor Signal
Tests need be done in order to note the affect of the LED light on the color sensor due to potential interference. The first experiment performed is designed to see how much interference will be caused as the distance between the LED and the color sensor changes.
Setup and Results
1. A white LED is used in this experiment because the white LED will cover the entire wavelengh ranges of the visible light. The experiment with the white LED can yield a general result, while the experiment with the colored LEDs will yield more specific result focused on the interference between the certain photodiode and the certain color.
- LED: 18950 mcd (millicandela), digikey part number:
C503B-WAN-CABBB151-ND
2. The experiment was performed under the two conditions; with the ambient light and without the ambient light.
3. The LED and the color sensor were placed at the same plane, and both are facing upward.
4. Distance between the color sensor and the LED is increased by 0.25 inch each time from 1 inch to 2.5 inch.
5. The amplified output, Vo as shown in the circuit diagram above, of each photodiode is measured.
With Ambient light
- Unit: Volt, V
| Distance | R | G | B |
|---|---|---|---|
| No LED | 1 | 1.4 | 0.469 |
| 1 inch | 1.259 | 1.716 | 0.832 |
| 1.25 inch | 1.185 | 1.619 | 0.757 |
| 1.5 inch | 1.135 | 1.529 | 0.669 |
| 1.75 inch | 1.097 | 1.503 | 0.613 |
| 2 inch | 1.086 | 1.481 | 0.589 |
| 2.25 inch | 1.071 | 1.47 | 0.563 |
| 2.5 inch | 1.06 | 1.453 | 0.546 |
Without the Ambient Light
- Unit: Volt, V
| Distance | R | G | B |
|---|---|---|---|
| No LED | 0.028 | 0.025 | 0.019 |
| 1 inch | 0.244 | 0.221 | 0.223 |
| 1.25 inch | 0.195 | 0.166 | 0.143 |
| 1.5 inch | 0.162 | 0.123 | 0.097 |
| 1.75 inch | 0.130 | 0.097 | 0.069 |
| 2 inch | 0.102 | 0.077 | 0.054 |
| 2.25 inch | 0.087 | 0.064 | 0.045 |
| 2.5 inch | 0.073 | 0.056 | 0.039 |
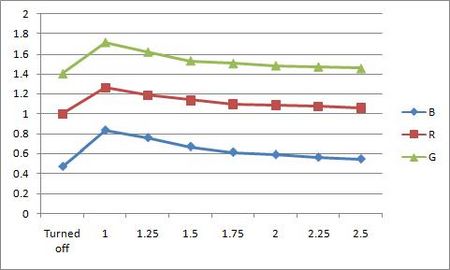
As you can see in the two graphs above, the color sensor is affected by
the light from the LED. The color sensor is most affectd by the LED
when the LED is closest to it. As the distance between the LED and the
color sensor increases, the interference decreases. When the color
sensor is most affected by the LED under the presence of the room
light, the output increases up to 25.9%, 22.6%, and 43.6 % of the
original output. As the LED is 2.5 inch away from the color sensor, the
output becomes very close to the original value.
In this experiment, we see that the lights from LEDs can affect the
color sensor. However, we used much brighter LED in this experiment
than the ones we use in the LED pattern board. The brightness of the
LED used in the experiment is 4 times larger than the ones in the LED
pattern board. Thus, more experiment with the LEDs used in the LED
pattern board is required.
LED Angle vs Color Sensor Signal
The second experiment is designed to see how much interference will be caused as the angle between LED and color sensor changes. Different from the first experiment, Vi, the voltage before amplified, is mesured since amplified output, Vo, easily reaches to the maximum.
Setup and Results
1. A white LED is used again in this experiment with the same reason above for the first experiment.
- LED: 18950 mcd, Digikey part number: C503B-WAN-CABBB151-ND
2. The experiment was performed under the two conditions; with the ambient light and without the ambient light.
3. In this experiment, the distance between LED and color sensor is kept constant, 1 inch.
4. Angle between LED and color sensor is increased by 15
