NU32v2: Using the Simulator
THIS PAGE REFERS TO A PRE-RELEASE VERSION OF THE NU32 PIC32 DEVELOPMENT BOARD. FOR INFORMATION, SAMPLE CODE, AND VIDEOS RELATED TO THE PRODUCTION VERSION (2016 AND LATER), AND TO THE CORRESPONDING BOOK "EMBEDDED COMPUTING AND MECHATRONICS WITH THE PIC32 MICROCONTROLLER," VISIT THE NU32 PAGE.
Introduction to the MPLAB Simulator
The MPLAB Simulator is a debugging tool that allows you to test code without programming it onto a PIC32. Simple debugging, such as watching the values of variables or registers, can be performed, as well as advanced features, such as simulating inputs from a UART. This tutorial will cover the basics of setting up the MPLAB simulator and how to run code inside a debugger using a slightly modified invest.c program that we saw in class.
Before running through this tutorial, make sure you have the MPLAB v8.xx software installed; see this page.
Creating a New Project
An MPLAB project file (.mcp) contains the information necessary for MPLAB to compile your source code. You can view the content of the file in any text editor to see what information it saves, for example, the name and location of your C files.
These directions assume that the project will be saved on a Windows Desktop under "Desktop\MyProject".
- Download the source code for this example and unzip the folder on the Desktop.
After opening MPLAB v8.xx:
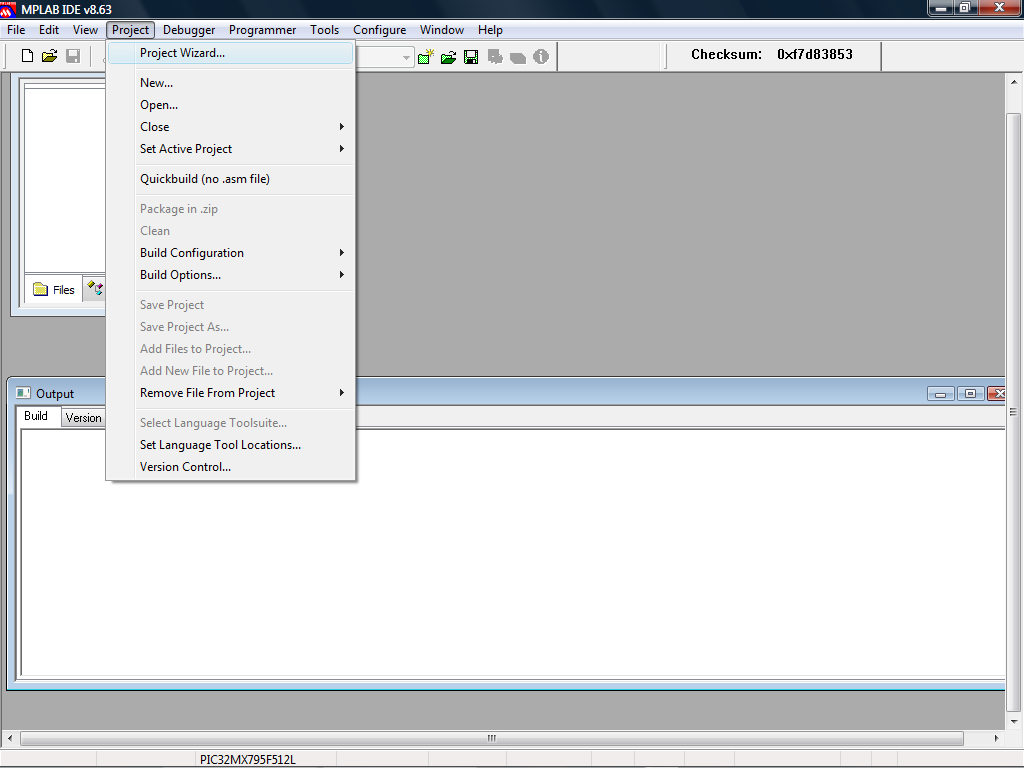
- Go to Project->Project Wizard
- a dialog box appears
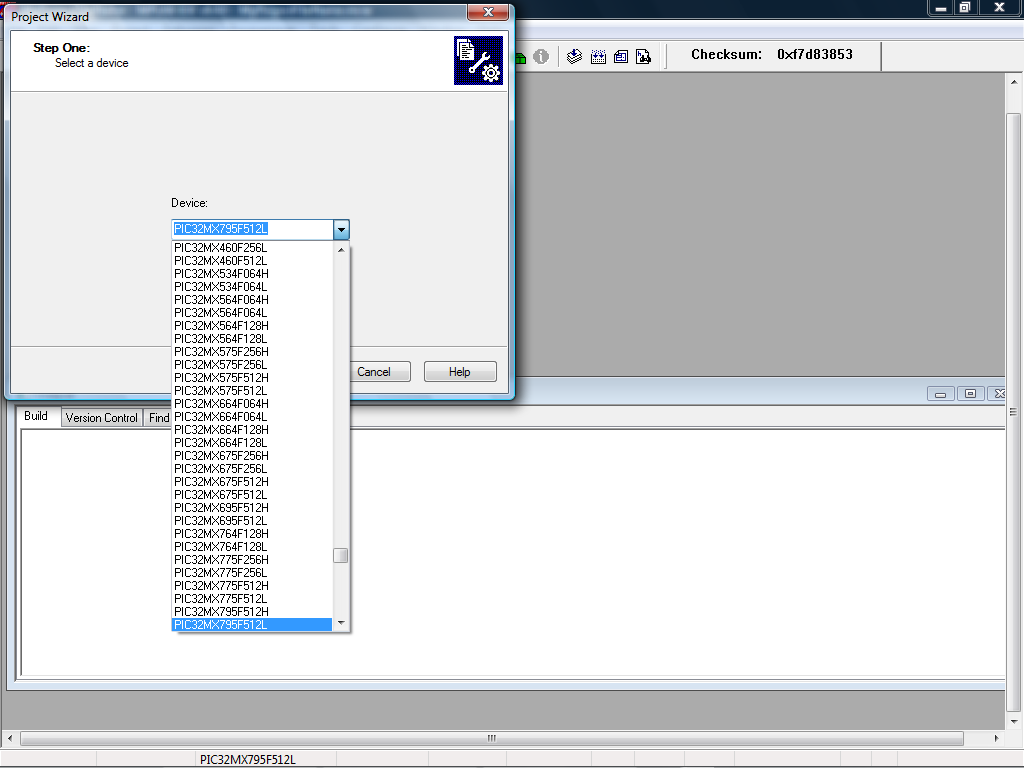
- Click "Next" to advance to the next screen and select your PIC
- our PIC is the PIC32MX795F512L
- Click "Next" to advance to the next screen
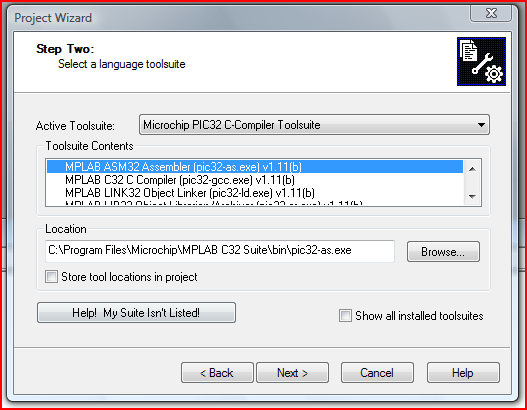
- In the "Active Toolsuite" field, select "Microchip PIC32 C-Compiler Toolsuite" from the drop-down list
- Click "Next" to advance to the next screen
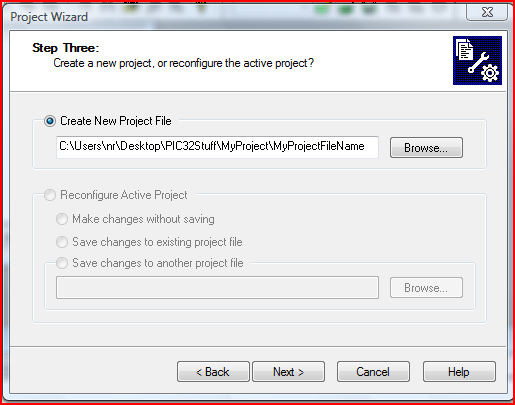
- Click the "Browse" button
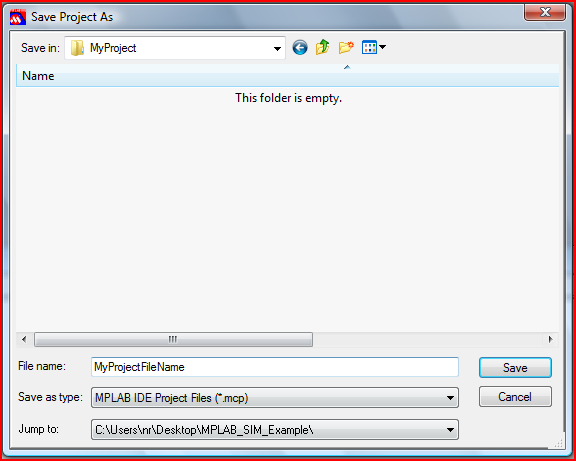
- the "Save Project As" dialog box appears
- In the dialog box, navigate into "MyProject" on your Desktop
- Enter the name of your project in the "File name" textbox
- our project is named "MyProjectFileName"
- Press the "Save" button
- you'll be returned back to "Step Three" of the Project Wizard
- the full path to your project should be displayed, make sure it's where you intend to save the project
- Click "Next" to advance to the next screen
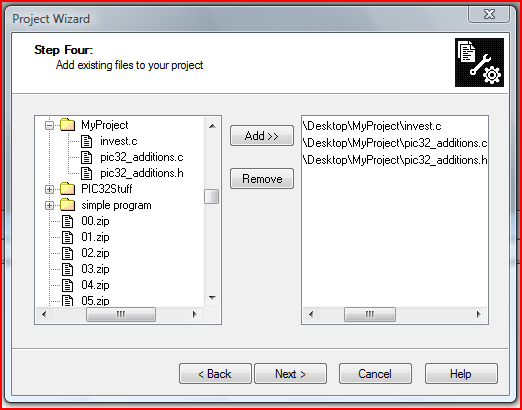
- Add invest.c to the project by
- selecting "invest.c" and clicking the "Add >>" button, which will place the file in the right window pane.
- Repeat for pic32_addition.c and pic32_addition.h
- Click "Next" to advance to the next screen
- You are now on the summary page
- if everything looks correct, click "Finish"
- otherwise, click "< Back" to make corrections
- Verify your steps by compiling your project, go to Project->Make
- you will see text scrolling in the "Build" tab of the Outputs window
- if the last line is "BUILD SUCCEEDED", then your project is setup correctly.
You can manage your project from Project in the file menu bar. For example, to add another C file, you can go to Project->Add Files to Project. There are also options to add a new file, remove current files, etc.
In addition to an MPLAB project file (.mcp), you have the option of creating a Workspace file (.mcw). The Workspace keeps track of information related to how you've customized MPLAB. It will keep track of how windows are laid out, the active debug tool, what PIC you are working with, and other IDE-specific options (unlike a .mcp file, you cannot view a .mcw file in a text editor). To create a workspace, go to File->Save Workspace. A workspace is not necessary for your project, so if MPLAB prompts you to save one, you can safely say no.
Setting up MPLAB SIM
To run the sample code in the simulator,
- Either complete Creating a New Project or download and unzip MplabSimExample.zip
- with the latter option, verify that the following 4 files are in the folder: invest.c, pic32_additions.c, pic32_additions.h, and invest.mcp
- Open the .mcp MPLAB project, for example, invest.mcp
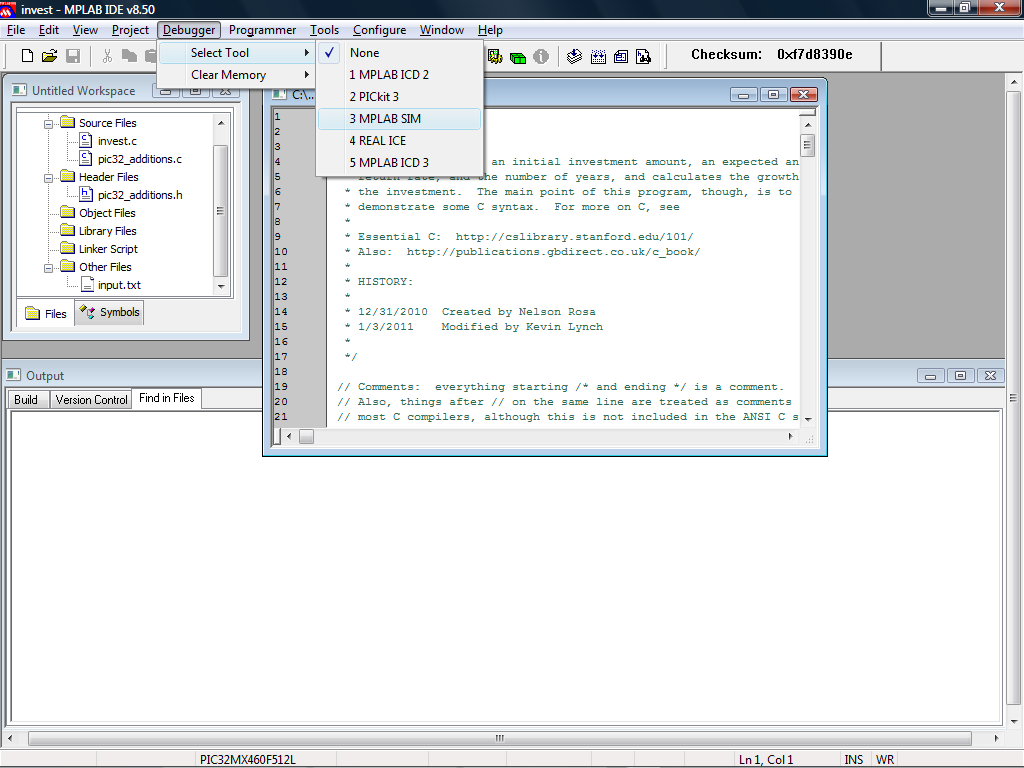
- Go to Debugger->Select Tool->MPLAB SIM
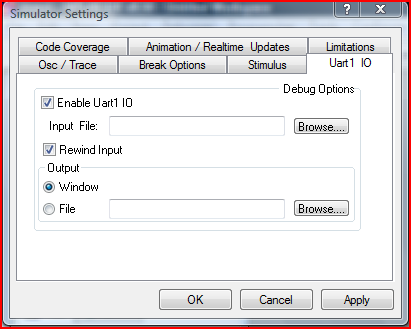
- Go to Debugger->Settings... and click on the "Uart1 IO" tab
- In the "Uart1 IO" tab
- click on "Enable Uart1 IO" checkbox
- click on the "Window" radio button
- hit "OK" to change the settings and close the window
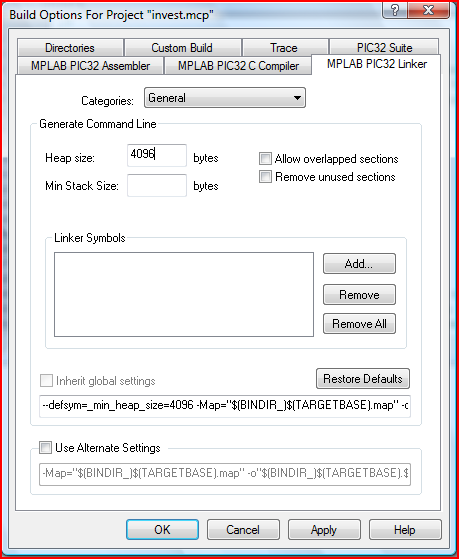
- Go to Project->Build Options...->Project, select the "MPLAB PIC32 Linker" tab and
- enter a heap size, 4096 bytes works for this example
- hit "OK" to change the settings and close the window
- Compile the program (you can press F10 or go to Project->Make)
- Run the debugger (press F9 or go to Debugger->Run) If you see text similar to what you saw on the first day of class scrolling by in the Output window, then everything is working correctly. Next, we'll briefly go over a few basic features of the debugger, but let's reset the debugger first.
- Halt the debugger by pressing F5 or Debugger->Halt
- Reset the simulation/microcontroller by pressing F6 or Debugger->Reset->Processor Reset
Working with the Debugger
The MPLAB debugger has several useful tools and commands. In this section, we will cover the following:
- setting breakpoints
- basic debugging commands: Halt, Reset, Step Into, Step Over, and Run
- understanding the Locals window.
The Basic Debug Commands
The debug commands do the following:
- Halt
- stops the program at the next line of code to be executed
- Reset
- resets the PIC to its default state and starts the program from the very beginning
- Step Into
- executes the next valid C expression in your code and then halts the program
- Step Over
- If the next expression is a function call, then it executes that function and then halts the program. Otherwise, for non-function calls, this is equivalent to Step Into. IMPORTANT, if you don't have the source code for a function you should STEP OVER it. Not doing so can lead to MPLAB not responding to your commands.
- Run
- executes the program from the last executed expression until a breakpoint is encountered or Halt is selected
There are several ways to use the debugging commands (see Table 1)
| Halt | Reset | Step Into | Step Over | Run | |
|---|---|---|---|---|---|
| Keyboard | F5 | F6 | F7 | F8 | F9 |
| Menubar | Debugger->Halt | Debugger->Reset->Processor Reset | Debugger->Step Into | Debugger->Step Over | Debugger->Run |
| Debugger Toolbar |
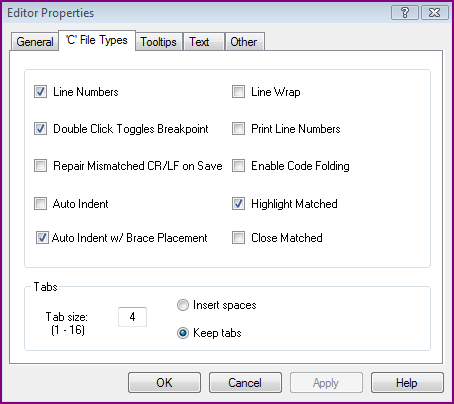
The walkthrough will use the keyboard shortcuts, but the other methods can be substituted for the shortcuts. Before we begin, make sure that invest.c is opened, line numbers are visible, and the debugger is not running and has been reset. If you cannot see line numbers, go to Edit->Properties..., and in the 'C' File Types tab, select Line Numbers.
Debugging invest.c
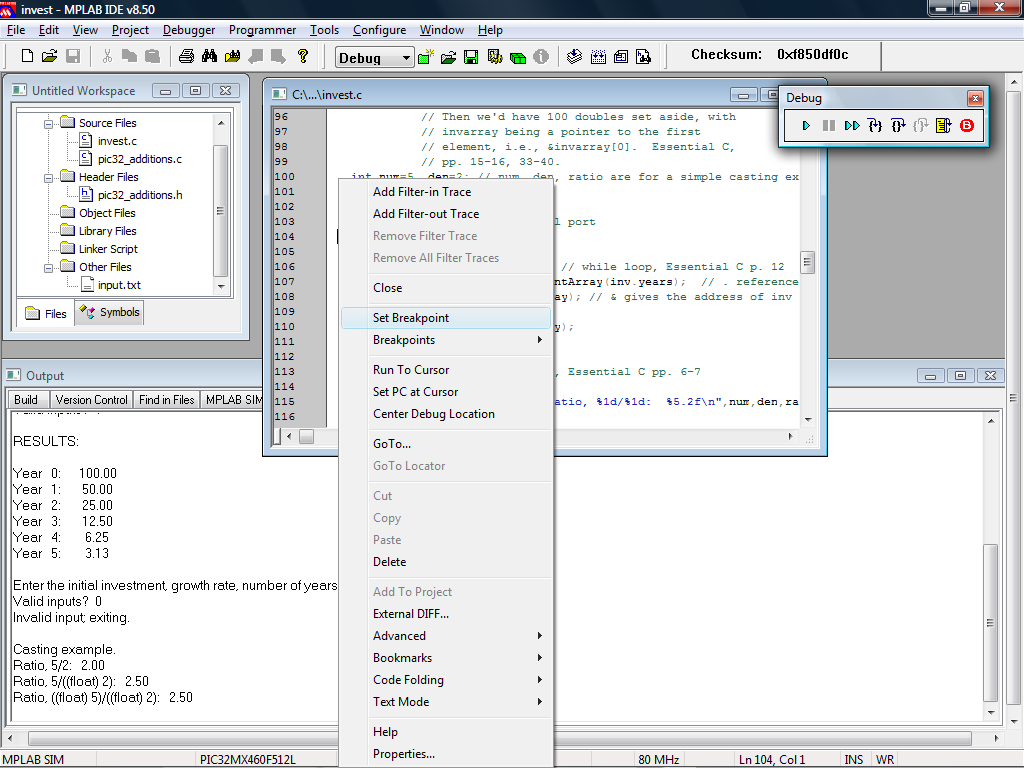
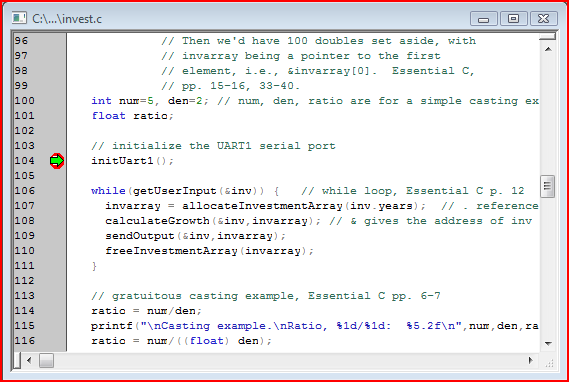
- Set a breakpoint at line 104 in invest.c
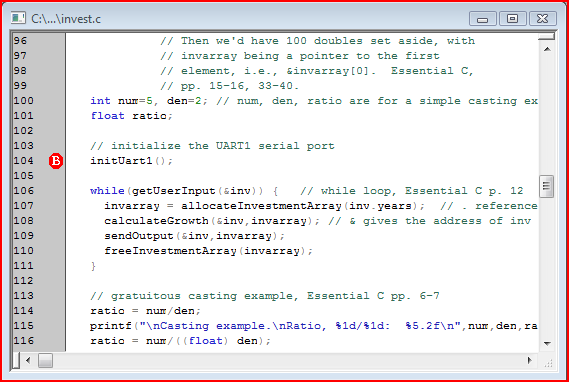
- A breakpoint allows you to stop a program mid-execution. You can set breakpoints at any time, even while the program is running. To set a breakpoint, double-click the gray side-pane on the number 104 or right-click the line of code at line 104 and select "Set Breakpoint".
- You should now see a red circle with the letter 'B' in it.
- Press F9 to start the debugger
- You'll see a green arrow on top of the breakpoint. The arrow indicates the next instruction that will execute when the program resumes. The next instruction to execute will be the function call to initUart1().
- If you hover over any local variable, like num, you can see its current value (by default the numbers are shown in hexadecimal).
- Press F8 to Step Over the initUart1() function.
- Notice how the debugger passed over this function. The code inside of it still executed! Alternatively, because we have access to the source code, we could have chosen to Step Into the function to see it in action. Instead, we step over it, because it contains code that we won't cover until later in the course.
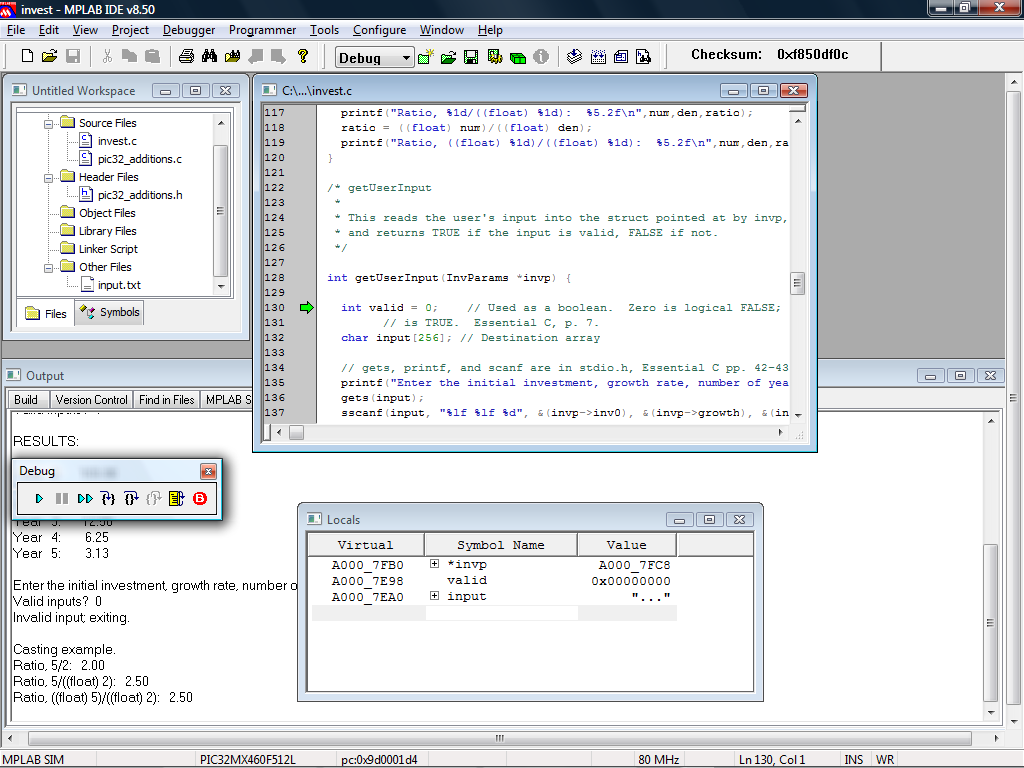
- The debugger has advanced the program to the next instruction in our main function (as denoted by the green arrow). The next instruction is a function call to getUserInput(...).
- Press F7 to Step Into getUserInput(...).
- The arrow is now at getUserInput(...)
- Instead of hovering over local variables to see their value, we can display them in a window
- Go to View->Locals, to bring up the Locals window.
- Press F8 once to advance the program
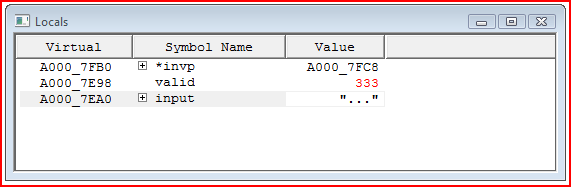
- You'll see the Locals window populated with values of the current local variables, such as valid and input.
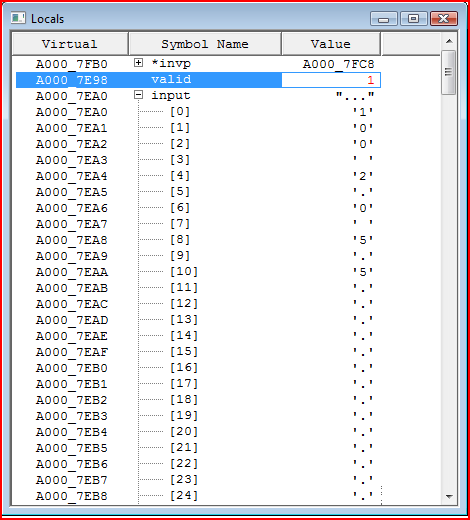
- Press the plus sign next to input to expand the array into its individual elements. Keep in mind that you can only see the individual values of a statically allocated array.
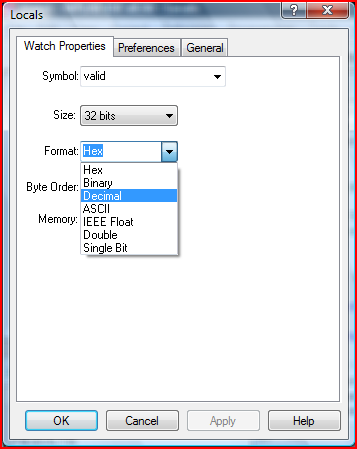
- In the Locals window, change the display of valid from hexadecimal to decimal by
- Keep pressing F8 until you hit line 145
- the Locals window now display new values for valid and input. The new value for valid should equal 1 or "true" due to the assignment in line 142
- a nice feature about a debugger is that you can change the value of any variable or array in real-time. The Locals window is one window where this is possible.
- Under the column "Value", double-click the field corresponding to the value of valid
- Change the value of valid from 1 to 333 and then press your enter key.
- this won't affect the normal execution of the program because the value is still true
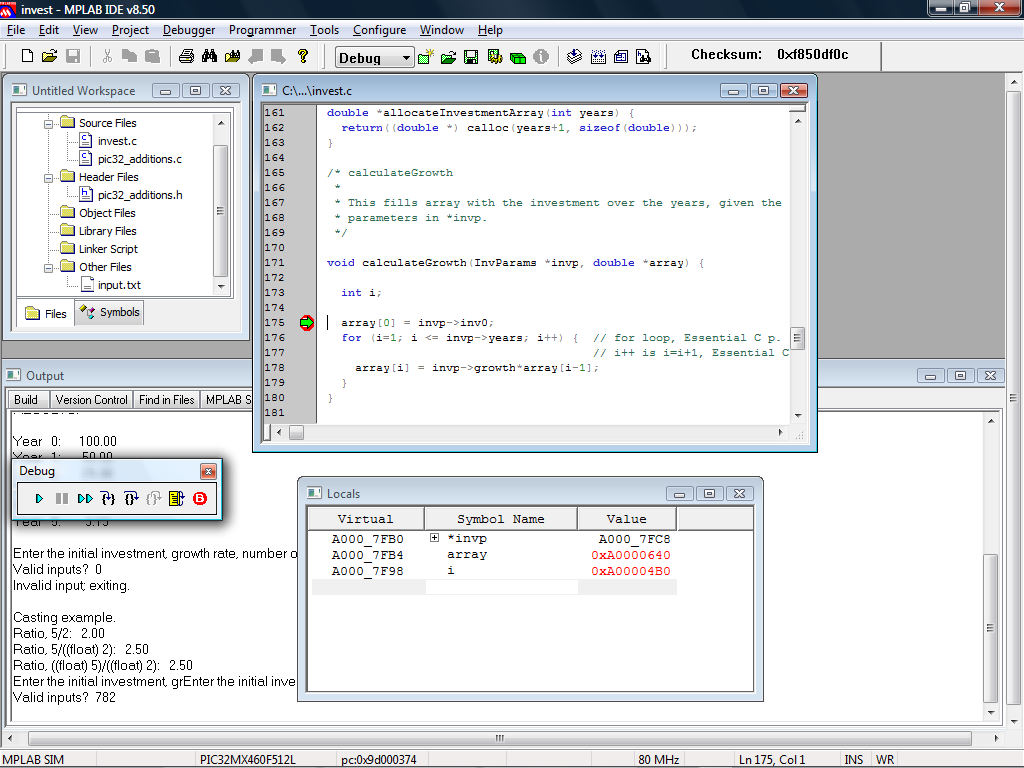
- Set another breakpoint in calculateGrowth(...) at line 175
- Press F9 to Run
- now you've skipped over a bunch of lines and stopped at the next breakpoint in the program.
- depending on the update rate of your Outputs window, you might be able to see that the ouput "Valid inputs? 333" has made its way onto the screen. We know from previous runs that the value is normally 1.
- Press F9 twice
- the program has finished executing, but the debugger is still in the "Run" state
- Press F5 to Halt the program
- typically this would stop at the next line of executable code, but we've reached the end of the program
- Press F6 to reset the program
- if you decide to press Run again, you'll start at the top of the program.
At this point you've covered the basics of working with a debugger. Feel free to practice what you've learned by running through the program again. You could, for example, change the value of i in the calculateGrowth(...) for-loop while the loop is running, set extra breakpoints, etc.
If you want to delve deeper into the debugger or simulator consult the MPLAB help files. Further information about the debugger can be found in the "MPLAB IDE Features/Debug Features" section of the "MPLAB IDE" .chm help file under Help->Topics.... The MPLAB SIM .chm help file also contains interesting information about the simulator, like simulating other peripherals and timing your code.
Troubleshooting MPLAB SIM
- MPLAB SIM isn't responding to any of my commands
- MPLAB SIM isn't perfect and if it doesn't respond to a command after a period of time, it may be caught in an infinite loop. You may have to restart the simulator by selecting Debugger->Select Tool->None and then Debugger->Select Tool->MPLAB SIM. If that doesn't work exit MPLAB and start again.
- The debugger isn't stopping at the breakpoint I set
- Did you make any changes to your code? The executable and the source code might be out of sync. Try a full recompile, Project->Clean followed by Project->Make and then try running the debugger again.