RGB Swarm Robot Project Documentation
Overview
The swarm robot project has gone through several phases, with each phase focusing on different aspects of swarm robotics and the implementation of the project. This entry focuses on the most recent phase of the project, covering topics such as, but not limited to, Xbee Interface Extension Boards, LED light boards, and changes made to the Machine Vision Localization System, and the overall conversion to LED boards and a controlled light environment. These entries help provide insight into setup and specific details to allow others to replicate or reproduce our results, and to provide additional information for those working on similar projects or this project at a later time. Other articles in the Swarm Robot Project category focus on topics such as the swarm theory and algorithms implemented, as well as previous phases of the project, such as motion control and consensus estimation. You may reach these articles and others by following the category link at the bottom of every page, or through this link - Swarm Robot Project.
RGB Swarm Quickstart Guide
Refer to RGB Swarm Robot Quickstart Guide for information on how start and use the RGB Swarm system and its setup.
Software
The following compilers were used to generate all the code for the RGB Swarm epuck project:
- Visual C++ 2010 Express - http://www.microsoft.com/express/Downloads/
- MatLab 7.4.0
- MPLAB IDE v8.33
All the code for the RGB swarm robot project has been moved off of the wiki and placed in to version control for ease. The version control used is GIT, http://git-scm.com/.
To access the current files, first download GIT for windows at http://code.google.com/p/msysgit/. Next you will need to have access to the LIMS server. Go to one of the swarm PCs or any PC which is set up to access the server and paste the following in to Windows Explorer:
\\mcc.northwestern.edu\dfs\me-labs\lims
Once you have entered your user name and password, you will be connected to the Lims server. Now you can open GIT (Git Bash Shell) and type the following in order to get a copy of the current files on to your Desktop:
cd Desktop
<PRESS ENTER>

git clone //mcc.northwestern.edu/dfs/me-labs/lims/Swarms/SwarmSystem.git
<PRESS ENTER>
You will now have the folder SwarmSystem on your Desktop. Inside, you will find the following folders:
- .git
- configuration
- DataAquisition
- debug
- ipch (this will be generated when you open a project in visual studio for the first time)
- OpenCV
- SerialCommands
- SwarmRobot
- VideoInput
- VisionCalibrationAnalysis
- VisionTrackingSystem
- XBeePackets
Environment Variables
Permanently set the windows environment variable SwarmPath to point to the SwarmSystem folder by running the setup.cmd in the main directory. It is important that the script is run from the SwarmSystem folder directly or the path will not be set correctly.
.git
This directory contains the inner workings of the version control system, and you should not modify it. See git documentation for details.
configuration
This directory contains the configuration files (calibration data and data associating LED patterns with epucks) generated and used by the Vision Tracking System
DataAquisition
Inside the DataAquisition folder you will find MatLab files for receiving data from the epucks. These files make use of the dll to send and receive commands with the epucks. A more detailed description of how to use these files can be found in RGB Swarm Robot Quickstart Guide: Analysis Tools
debug
This directory contains the files output by the Visual C++ compiler. It also contains DLL files from the OpenCV library which are necessary to run the Vision Tracking System.
ipch
This is generated by visual studio, and is used for its code completion features. It is not in version control and should be ignored.
OpenCV
This directory contains header files and libraries for the OpenCV project. Currently we are using OpenCV version 2.10. Leaving these files in version control lets users compile the project without needing to compile / set up OpenCV on the machine.
SerialCommands
This folder contains the files for the SerialCommands DLL (Dynamic Linked Library). This DLL allows multiple programs (including those made in MATLAB and in Visual Studio) to use the same code to access an XBee radio over the serial port. The DLL exports functions that can be called from MATLAB or a Visual Studio program and lets these programs send and receive XBee packets.
If you write another program that needs to use the XBee radio, use the functions provided in the SerialCommands DLL to do the work.
Currently, this code is compiled using Visual C++ Express 2010, which is freely available from Microsoft.
SwarmRobot
In this folder you will find all of the files which are run on the epuck. In order to access these files simply open the workspace, rgb_swarm_epucks_rwc.mcw in MPLAB. If any of these files are edited, they will need to be reloaded on to the epuck by following the instructions in RGB Swarm Robot Quickstart Guide: e-puck and e-puck Code
VideoInput
This contains the header and static library needed to use the VideoInput library. Currently, this library is used to capture video frames from the webcams.
VisionCalibrationAnalysis
Contains MATLAB programs used for analyzing the accuracy of the calibration. By pointing these programs to a directory containing Vision System configuration information (i.e the configuration directory), you can get a rough measure of the accuracy of the current camera calibration.
VisionTrackingSystem
This is the main Vision Tracking System project. This program processes images from the webcams to find the position of the epucks, and sends this information back to the epucks over an XBee radio. It is the indoor "gps" system.
Currently, this code is compiled with Visual Studio 2010 Express, which is freely available from Microsoft.
XBeePackets
This directory contains code for handling the structure of packets used for communicating over the XBee radio. This code can be compiled by Visual Studio and is used in the SerialCommands dll for forming low level XBee packets. It is also combiled in MPLAB and run on the XBees. In this way, we have the same source code for functions that are common to the epucks and the vision/data pc (currently just code dealing with our communication protocol).
Hardware
XBee Interface Extension Board Version 2
Previous Version
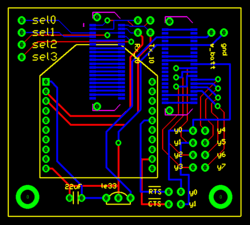
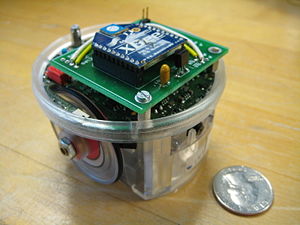
The previous version of XBee Interface Extension Board, designed by Michael Hwang.
Its configuration is shown in the figure on the left, with an actual image of the board mounted on an e-Puck seen in the figure in the center. This version of the XBee Interface Board does not contain a color sensor in it. Details about this version of XBee Interface Extension Board, such as parts used and Traxmaker files can be found on the Swarm Robot Project Documentation page.
Version 2
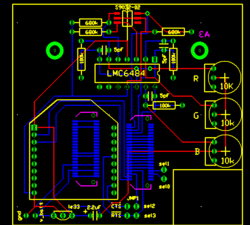
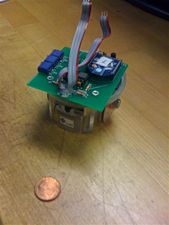
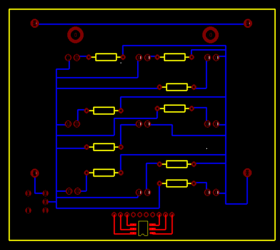
This is the updated version of the Xbee board, or XBee Interface Extension Board Version 2. It is designed by Michael Hwang to accommodate further projects in the Swarm Robot Project. For this reason, the Xbee Interface Extension Board Version 2 has a color sensor circuit built in. The details of the color sensor circuit can be found in the color sensor section below. A copy of the Traxmaker PCB file for the Xbee Board Version 2 can be found below:
The RTS flow control line on the XBee is connected to the sel3 line of the e-puck. Although the CTS line is not connected to the sel2 pin in this board design, it can be easily connected with a jumper.
The XBee Interface Extension Board Version 2 design was actually built and implemented on the e-puck #3. In order to see if there is any working problem in this board design, it is first tested with the other e-puck which uses the previous XBee Boards.
The e-puck #3 upgraded with the new XBee board did not show any problem in communicating with other e-pucks. According to the goal defined, all e-pucks, including e-puck #3, locate themselves to the desired location.
Color Sensor Circuit
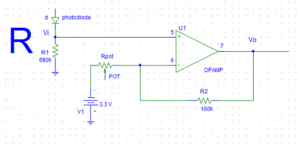
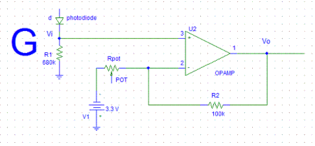
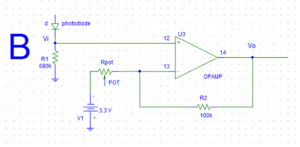
As you may draw from the circuit diagrams above, as each photodiode receives light, a certain amount of current start to flow through the photodiodes and generates a voltage across R1 = 680K. Each photodiode is designed to detect the certain range of wavelength of the light, and the amount of current flowing through the photodiodes is determined according to the amount of the corresponding light to each photodiode. The op-amp (LMC6484) takes the voltage generated across R1 as the input signal, amplifying it by a ratio particular to the circuit. This ratio is also known as gain, and is defined by resistance of the potentiometer. The now amplified output is then sent to the analog digital converter, which on the e-Puck had been used as the X,Y, and Z axis accelerometers. This convenient, as each accelerometer axis can be used as a channel for the color sensors three colors. The converted signal can then be used to measure the response of the color sensor to light. The corresponding equation for the circuits illustrated above are as follows:
- Rpot = resistance of the potentiometer (shown in the diagram)
- R2 = 100K (shown in the diagram)
- Vi = voltage across R1 = 680K, which the op-amp takes as an input
- Vo = output signal amplified from the op-amp
The gain of the color sensor circuits is approximately 20. Thus, the input voltage, Vi, is amplified to be 20Vi, which is Vo. As mentioned above, the gain can be adjusted properly by controlling the resistance of the potentiometer.
As shown in the circuit diagram on the left, the siganl from the red photodiode goes into the pin #5, and the amplified signal is sent out through the pin # 7. Similarly, the signal from the green photodiode goes into the pin #3 and it is sent out from pin #1 while the signal from the blue photodiode goes into the pin #12, and it is sent out from pin #14.
Output Pins
- Pin #7 - Amplified Red photodiode signal
- Pin #1 - Amplified Green photodiode signal
- Pin #14 - Amplified Blue photodiode signal
Parts used
Parts used in both the previous version and the new version of XBee Interface Extension Board
- 2x 10 pos. 2 mm pitch socket (Digikey S5751-10-ND)
- LE-33 low dropout voltage regulator (Digikey 497-4258-1-ND)
- 2.2uF tantalum capacitor (Digikey 399-3536-ND)
- 2x Samtec BTE-020-02-L-D-A (Order directly from Samtec)
- 0.1"header pins for RTS and CTS pins (you can also use wire for a permanent connection)
- 2x 0.1" jumpers for connecting RTS and CTS pins if you used header pins(Digikey S9000-ND)
Additional parts for new version of XBee Interface Extension Board
- 3x 100K resistors
- 3x 680K resistors
- 3x 10K potentiometer
- 3x 5pF capacitor
- 1x RGB color sensor (Order directly from HAMAMATSU, part#:s9032-02, Datasheet)
- 1x High impedence op-amp LMC6484
Future modifications
As mentioned in the overview, the black dot patterns of e-pucks are replaced with new LED patterns by implementing LED pattern board at the top of each e-puck. Thus, in order for the color sensor to collect data properly, it is necessary to move the color sensor from the XBee Interface Extension Board to the LED pattern board so that nothing will block the color sensor. All other components for the color sensor circuit remains in the XBee Interface Extension Board and only the color sensor will be place in the LED pattern board. We can use a jumper to connect the color sensor placed at the LED pattern board to the color sensor circuit place in the XBee Interface Extension Board. The datails of this LED pattern Board will be presented at the section below.
LED Pattern Board
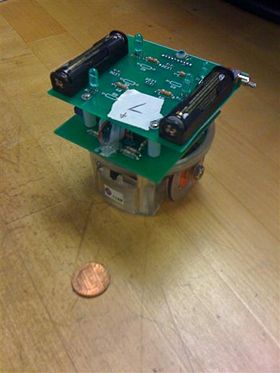
This is the LED pattern board, which was introduced for the RGB Swarm Robot Project. Currently, the unique black dot pattern of each e-puck was used for the machine vision system to recognize each e-puck. However, this black dot pattern requires a white background in order for the machine vision system to recognize e-pucks. The new LED pattern board uses LEDs with the proper brightness, instead of the black dot pattern. By doing so, the machine vision system can now recognize e-pucks on any background. The reason why this LED pattern is recognized on any background will be presented briefly in the Code section below. In addition, in order to apply this LED pattern to the machine vision system, we made a modification in code. This modification will also be presented in the Code Section below. The PCB file can be downloaded here:
- LED Pattern Board.zip
- This file contains the Traxmaker PCB files for an individual LED Pattern Board, as well as a 2x2 array, along with the necessary Gerber and drill files necessary for ordering PCBs.
LED Pattern Board Design
This LED Pattern Board is created using Traxmaker. This LED Board design can be downloaded here: Although we replaced the black dots with LEDs, we maintain each pattern of dots. The horizontal distance and the vertical distance between the two adjacent LEDs are both 0.8 inch. In order to reduce power consumption of the e-puck battery, we implement a seperate pair of AAA batteries to supply power to the LEDs. This LED board can be turned on and off by the switch. The millicandela rating of the LEDs used is 4850 mcd. In addition, this LED has diffused lens style. The reason to choose this LED is that it has a proper brightness and power consumption, and it is diffused so that the machine vision system can capture this LED in any places.The resistor used are 68.7 ohm.
As mentioned in the XBee Interface Extension Board section, the color sensor has to be moved to this LED pattern board from the XBee Interface Extension Board so that nothing blocks the sensor. Thus, as you can see in the Figure on the left, the color sensor is place at the front, and each photodiode is connected to the 10 pin header. This header connects the color sensor on the LED pattern board to the remaining part of color sensor circuit on the XBee Interface Extension Board v2.
Parts used
- 3x LED (Digikey 516-1697-ND): Some e-pucks require 4 LEDs since they have a pattern composed of 4 dots
- 3x 68.7 ohm resistors : Some e-pucks require 4 resistors since they have 4 LEDs
- 2x AAA Battery Holder (Digikey 2466K-ND)
- 1x Switch (Digikey CKN1068-ND)
- 1x RGB color sensor (Order directly from HAMAMATSU, part#:s9032-02)
- 1x 10 pos. 2 mm pitch socket (Digikey S5751-10-ND)
Tests
LED Distance vs Color Sensor Signal
Tests need be done in order to note the affect of the LED light on the color sensor due to potential interference. The first experiment performed is designed to see how much interference will be caused as the distance between the LED and the color sensor changes.
Setup and Results
1. A white LED is used in this experiment because the white LED will cover the entire wavelengh ranges of the visible light. The experiment with the white LED can yield a general result, while the experiment with the colored LEDs will yield more specific result focused on the interference between the certain photodiode and the certain color.
- LED: 18950 mcd (millicandela), digikey part number: C503B-WAN-CABBB151-ND
2. The experiment was performed under the two conditions; with the ambient light and without the ambient light.
3. The LED and the color sensor were placed at the same plane, and both are facing upward.
4. Distance between the color sensor and the LED is increased by 0.25 inch each time from 1 inch to 2.5 inch.
5. The amplified output, Vo as shown in the circuit diagram above, of each photodiode is measured.
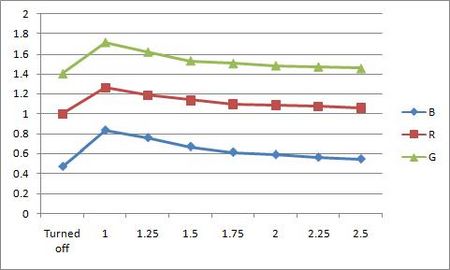
With Ambient light
- Unit: Volt, V
| Distance | R | G | B |
|---|---|---|---|
| No LED | 1 | 1.4 | 0.469 |
| 1 inch | 1.259 | 1.716 | 0.832 |
| 1.25 inch | 1.185 | 1.619 | 0.757 |
| 1.5 inch | 1.135 | 1.529 | 0.669 |
| 1.75 inch | 1.097 | 1.503 | 0.613 |
| 2 inch | 1.086 | 1.481 | 0.589 |
| 2.25 inch | 1.071 | 1.47 | 0.563 |
| 2.5 inch | 1.06 | 1.453 | 0.546 |
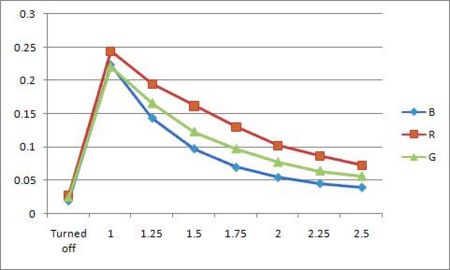
Without the Ambient Light
- Unit: Volt, V
| Distance | R | G | B |
|---|---|---|---|
| No LED | 0.028 | 0.025 | 0.019 |
| 1 inch | 0.244 | 0.221 | 0.223 |
| 1.25 inch | 0.195 | 0.166 | 0.143 |
| 1.5 inch | 0.162 | 0.123 | 0.097 |
| 1.75 inch | 0.130 | 0.097 | 0.069 |
| 2 inch | 0.102 | 0.077 | 0.054 |
| 2.25 inch | 0.087 | 0.064 | 0.045 |
| 2.5 inch | 0.073 | 0.056 | 0.039 |
As you can see in the two graphs above, the color sensor is affected by the light from the LED. The color sensor is most affectd by the LED when the LED is closest to it. As the distance between the LED and the color sensor increases, the interference decreases. When the color sensor is most affected by the LED under the presence of the room light, the output increases up to 25.9%, 22.6%, and 43.6 % of the original output. As the LED is 2.5 inch away from the color sensor, the output becomes very close to the original value.
In this experiment, we see that the lights from LEDs can affect the color sensor. However, we used much brighter LED in this experiment than the ones we use in the LED pattern board. The brightness of the LED used in the experiment is 4 times larger than the ones in the LED pattern board. Thus, more experiment with the LEDs used in the LED pattern board is required.
LED Angle vs Color Sensor Signal
The second experiment is designed to see how much interference will be caused as the angle between LED and color sensor changes. Different from the first experiment, Vi, the voltage before amplified, is mesured since amplified output, Vo, easily reaches to the maximum.
Setup and Results
1. A white LED is used again in this experiment with the same reason above for the first experiment.
- LED: 18950 mcd, Digikey part number: C503B-WAN-CABBB151-ND
2. The experiment was performed under the two conditions; with the ambient light and without the ambient light.
3. In this experiment, the distance between LED and color sensor is kept constant, 1 inch.
4. Angle between LED and color sensor is increased by 15º each time from 0º to 90º.
When the angle is 0º, the LED and the color sensor is placed at the same horizontal plane. The LED is facing toward the color sensor(this means that the LED is parallel to the horizontal plane with its head facing the color sensor, which is placed on the same horizontal plane), and the color sensor is facing upward. We increased the angle by 15º each time, and increasing amounts of light from the LED shines onto the color sensor. When the angle is 90º, the LED is right above the color sensor, facing the color sensor directly. This means that the LED and the color sensor are now on the same vertical line, and the LED is facing downward.
5. The voltage before amplified, Vi as shown in the circuit diagram above, of each photodiode is measured.
- The reason to measure the volatage before amplified is that the output becomes too large after amplified.
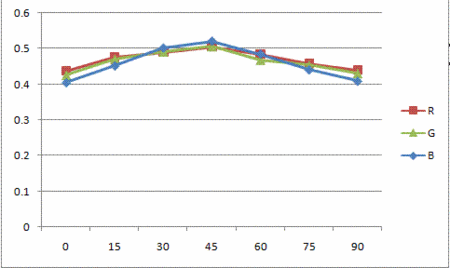
With the Ambient Light
- Unit: Volt, V
| Angle | R | G | B |
|---|---|---|---|
| 0º | 0.437 | 0.425 | 0.404 |
| 15º | 0.475 | 0.470 | 0.451 |
| 30º | 0.490 | 0.491 | 0.501 |
| 45º | 0.505 | 0.506 | 0.520 |
| 60º | 0.484 | 0.468 | 0.484 |
| 75º | 0.457 | 0.453 | 0.440 |
| 90º | 0.439 | 0.430 | 0.408 |
Without the Ambient Light
- Unit: Volt, V
| Angle | R | G | B |
|---|---|---|---|
| 0º | 0.446 | 0.436 | 0.416 |
| 15º | 0.454 | 0.491 | 0.461 |
| 30º | 0.493 | 0.505 | 0.480 |
| 45º | 0.512 | 0.521 | 0.520 |
| 60º | 0.498 | 0.486 | 0.491 |
| 75º | 0.498 | 0.492 | 0.487 |
| 90º | 0.485 | 0.479 | 0.515 |
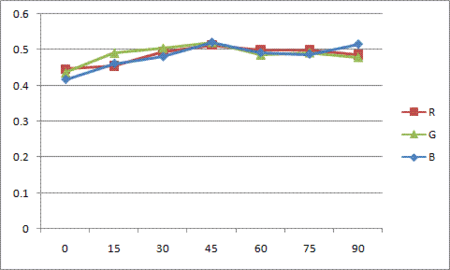
As the first experiment, two graph above shows that the color sensor is affected by the light from the LED. The color sensor is most affectd by the LED when the angle between two is 45º. The inteference increases as the angle goes to 45º, and reaches to the peak at 45º. Then it decreases as the angle goes to 90º. When the color sensor is most affected by the LED under the presence of the room light, the output increases upto 15.6%, 19.1%, and 28.7% of Vi. As angle becomes 90º, the output becomes very close to the value at the angle of 0º. The reason why the interference is reduced as the angle reaches 90º is that the ambient light presented are blocked by the LED board. When we perform this experiment, the LEDs are implemented on the LED plane. This LED plane blocks the light and make a shadow on the color sensor. Thus, the amount of light that the color sensor receives decreases. That is why the output becomes close to its original value while the angle increases.
Next Steps
The LED Pattern Board design above needs to be modified in the following parts.
- The hole size for the LEDs has to increase so that it can accomodate the standoff of the LED chosen.
- The hole size for the switch has to increase so that the switch can be completely inserted through the hole.
- Currently, 10 pos 2mm pitch socket is used to connect the color sensor to the circuit using wires. Instead, the proper header for the color sensor has to be found to connect the color sensor and the circuit more conveniently.
Physical Setup
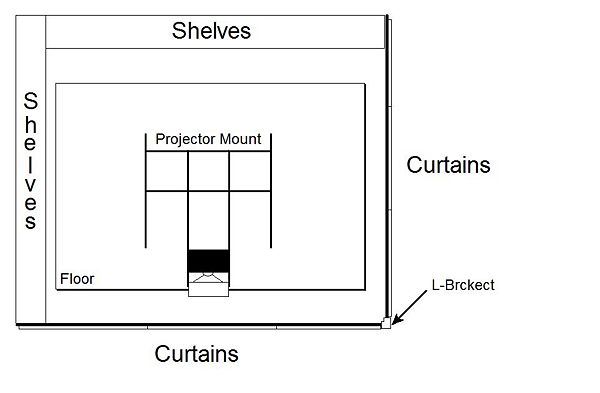
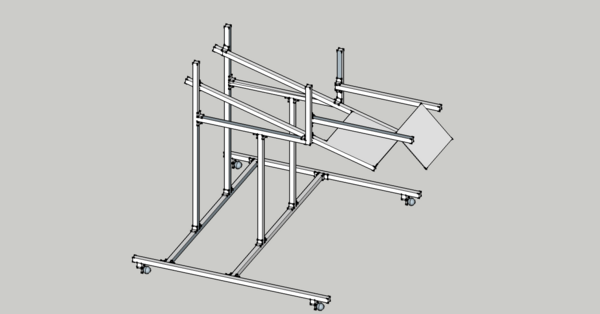
In the RGB swarm robot project, the epucks pick up light from a projector. This projector has to project onto the floor so that the top mounted light sensors can pick up the light. The floor which the epucks roll on must be completely enclosed so that the only light which reaches it, is the light from the projector. Also this floor must be smooth, flat and durable. See the overhead view below.
Curtains
The floor is enclosed by two walls and 6 curtains. Two bars protrude from the walls and are connected by an L-joint. There are 3 Eclipse absolute zero curtains on each bar (see diagram). These curtains block 100% light and are sewn together so that no light comes through between them. Covering the whole enclosure, above the projector mount are 7 more curtains sewn together to block all light.
Floor
The floor is 3 sheets of MDF(Medium Density Fiberboard) screwed to a frame of 2x4s. There are 5 2x4s arranged parallel to the longest side and smaller 2x4s arranged where the sheets meet. It is spackled and painted to give a smooth even surface. This floor should not be stepped on with shoes to prevent scuffing and should be swept before each experiment.
There are 25 calibration markings on the floor. The center of these markings make 5 points ranging from -1300mm to 1300mm in the x direction and 5 points from -880mm to 880mm in the y direction. The calibration markings consist of two perpendicular lines with a dot and "C" marking on one of the lines. An epuck should be placed so that the color sensor side lines up with the line with the dot and "C" marking and the left wheel should line up with the other line. This orientation of the epuck places the center LED on the centers of the calibration markings, which are the points said above. This configuration is used to calibrate the cameras, see <insert camera calibration procedure>.
Projector
The projector is a Benq MP771 DLP prpjector. It has a digital user manual on a CD in the projection computer.
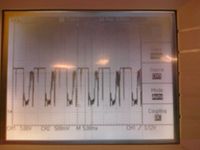
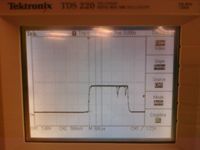
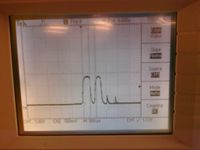
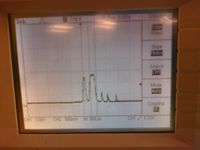
Since it is DLP, it has an array of tiny mirrors which reflect the light from the bulb. The light from the bulb is shown through a color wheel which shines red, green, and blue on to the mirror array. The frequency with which the mirrors turn on and off (reflect light and don't) determines the intensity of light. For example if a dark red was being projected, the mirrors would be on more than off in a certain interval. In the case of our projector that interval is 8.2 millisecond. See the pulse width modulation below.
Each mirror represents a different pixel projected from the projector. This projector has a resolution of 1024 x 768, so in order to get a 1 to 1 pixel ratio, the projection computer should be set to display at 1024 x 768.
As detailed in the user manual, the projector should not be tilted forward or backward more that 15°. Because of this and the wide throw of the projector, a keystone projection shape could not be avoided on the floor. The projector is currently set to compensate for the maximum amount of keystone.
The size of the projected image is currently 113.25" x 76.5" or (in mm).
Before performing any experiments, allow the projector to warm up for at least 20 minutes.
Projector PWM Waveform
The projector pulse width modulates the color output. So you need to average the measured intensity over the period of the projector to measure the color. The period of the projector is 8.2ms.
Pulse Width Modulation can lead to problems when recording data. For instance, when first setting up data recording for the Xbee radios, it was discovered that the RGB values would fluctuate across a period of several minutes, skewing that data. Doing more research into the projector, such as by using the digital oscilloscopes, the problem was fixed on the fact that projector does not project exactly across 120 hz, resulting a period that is slight off from the 8ms that was being used to sample data. The solution to the problem was to record several samples (currently 4), average the samples, and use the average the correct value. There is time to record 4 samples, or 32ms of data, as puck has 400ms (.4s) to record data, construct a packet, and send the packet out. The result of this averaging is that the irregularities due to PWM are phased out, resulting in a clean and stable trace without low-frequency modulations.
Projector Mount
The projector mount was ordered online using 80/20®. The order form complete with the parts for the mount is here [1]. The mount is highly adjustable so that the projector can be mounted at any angle and height. The cameras are mounted so that they cover the entire projected area. The cameras overlap by one object described in the camera calibration routine.
Conclusion
The new XBee Interface Extension Board design was tested, and we found out that it does not have any problem. In addition, the black dot pattern of the e-pucks are upgraded to LED patterns. The advantage of this improvement is that the machine vision system can recoginize each e-puck no matter where the e-pucks are located. The color of the background also does not affect the vision system. However, we had to move the color sensor to the LED pattern board since the LED pattern board will block the sensor if the sensor is located in the XBee Interface Extension Board. Thus, we now consider the light interference between the LEDs and the color sensor. In the light interference test, we found out that the color sensor is affected by the light from LED. However, since we used much brighter LEDs in our light interference test than the LEDs used for the LED pattern board, we have to do more experiment on this in order to have more accurate interference data.
Future Work and To Do
DV Camera
A camera will be used to record and document the experiments while they take place inside the tent. The quality must be high enough to show/broadcast to interested parties (such as online video streaming), and possible for presentations, etc.
- Get a DV camera, check for fit with the existing physical set up (see projector/webcam framework)
- Check DV camera control functionality when plugged into computer (firewire control), such as play/pause/record controls from the computer to the camera
- Select a camera, wide angle lens, fireware card
- Mini DV cameras seem to be the best bet as they are designed to accommodate for control via firewire cable due to necessity of capturing data from the tape
- A 0.6X magnification lens accommodates 9' x 6' floor, allowing for the camera to be only 5.4' off the ground
- The amount of magnification (x) = 1/x amount of FOV; thus a 0.5X magnification lens = 2X amount of FOV
- Find the amount of focal length the camera has at its widest view (this is the smallest number, and in mm), and then apply the magnification appropriately), so 0.5X magnification = 0.5X focal length
- Go online to this site, look for the Angular Field of View Calculator to determine the horizontal and vertical FOV angles
- Use these angles, to calculate the height need for the camera to capture the entire image
- For example, if the camera is mounted above the center of the floor, the width of the floor is 9', and the horizontal FOV calculated is 79.6º using a focal length of 36mm converted to 21.6mm by 0.6X magnification, then the math to get the height is: 9'/2 = 4.5', 79.6º/2 = 39.8º; 4.5'/atan(39.8º) = 5.4'
Vision System
- Complete vision system calibration by being able to move from floor coordinates to pixel row/column coordinates and then back
- Update vision system to accommodate change between black/white pattern recognition and LED/light intensity recognition (eliminate going through code)\number of calculations and eliminating use of sin/cos)
