NUScope 2011
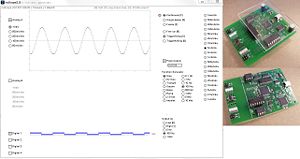
The nuScope is a PIC32 based oscilloscope and function generator.
It has the following abilities:
- bipolar power supply, providing +5v and -5v at up to 100mA
- 2-channel analog and 5-channel digital oscilloscope
- function generator
NUScope with Bootloader (For BME306 and ME333)
Download and unzip NUScope_Bootloader.zip.
The NUScope from 2010-2011 ME233 and BME305 has been reprogrammed with a Bootloader, a small program that allows you to install other firmware on the NUScope, making it a more flexible tool.
To get the NUScope into bootloader mode, press and hold the push button on the NUScope while plugging it into your USB port. In bootloader mode, the green LED on the left side of the board will blink.
Run the NUScope_boot application in NUScope_Bootloader. Under 'Select a bootloader port', select the larger of the two ports that install when you plug your board in. Click 'SELECT_HEX' and navigate to NUScope_v3.hex. Click 'CONNECT', and then click 'PROGRAM'. When the programming process is complete, click 'RUN' and exit NUScope_boot.
You can now run the nuScope2_2 application in NUScope_Bootloader. This is an updated version of the oscilloscope program you used in ME233 and BME305.
In ME333, this is all you have to do. In BME306, you can make the NUScope be more like a data acquisition board for taking more data by repeating the process:
Run NUScope_boot again, but this time choose NUScope_DAQ.hex. Program this onto your board, but do not exit after clicking 'RUN'.
On the right side of the screen, select the smaller of the two ports that install when you plug your board in under 'Select a debug port'. Above 'SEND_TO_NU32', you can send commands to the NUScope in the form:
's [sample_rate] [number_of_samples];' -> don't forget to to end with a ';'!
For example, 's 100 100;' will return 100 analog samples from A and B taken at 100Hz, or 1 second worth of data.
Right now, valid sample rates are 100Hz, 1kHz, 10kHz, and 100kHz. Number of samples must be between 1 and 10000.
How to Use the nuScope
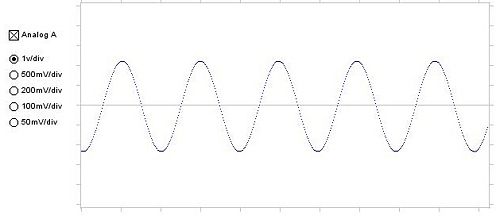
Analog oscilloscope There are two analog oscilloscope channels which are digitized at 100,000 samples/second. These are the Analog A and Analog B traces. Using the radio buttons to the left of the trace, you can adjust the sensitivity of each channel between 1 volt/division (+5 to -5 volts full scale) and 50mV/division. The "divisions" are the gray tick marks on the vertical axis, shown below. Note: The analog channels don't work when the power supply is disabled.
Digital oscilloscope There are five digital oscilloscope channels which are digitized at up to 10,000,000 samples/second. Four of the channels are inputs, D1 - D4. One of the channels are outputs, do, discussed below.
Function generator There is one function generator output, Fn, discussed below.
Sweep speeds The sweep speed can be adjusted between 1 second/division and 1 microsecond/division. In the trace display there are 10 divisions horizontally, indicated by the gray tick marks.
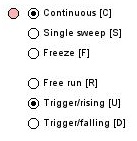
Sweep modes Sweeps can run continuously, or you can freeze one sweep. You can select Continuous or Freeze modes using the radio buttons (as shown below), or the equivalent keystrokes C or F. Each time you click Single Sweep (or type S) one new sweep will be displayed, and then frozen.
Triggering In general the graph will "roll" as new traces overwrite old ones, because the waveform is not at the same point in its cycle as each sweep begins. This is Free Run mode. To get a stable view you can freeze one sweep.
Better, you can use the trigger feature, which shows a continuously updating display but starts each sweep when the waveform passes a level that you select, so that the trace usually retraces itself accurately. You can select the "trigger level" by clicking on any of the traces; the trigger level will be indicated by a pink horizontal line, as shown in the Analog B trace above. The pink trigger level line is displayed only when the scope is in Trigger/Rising or Trigger/Falling mode.
In Trigger/Rising mode (keystroke U for "up") a triggering event is identified when the signal trace is rising and gets to the trigger level. In Trigger/Falling mode (keystroke D for "down") a triggering event is identified when the signal trace is descending, and gets to the trigger level. In the Analog B trace above you can see that the sweep began when the rising signal trace got to the red trigger level. Any of the 8 channels may be used for sweep triggering.
The "sweep dot" blinks pink when sweep data is received from the scope hardware, and otherwise it is gray. If the trigger level is set such that no triggering events occur, the dot will be gray because the scope hardware is never finding data to send. In freeze mode, however, the scope hardware can continue to send data to the Mac/PC, but the Mac/PC is not displaying the new data. The dot will be pink in this situation, since data is being transmitted.
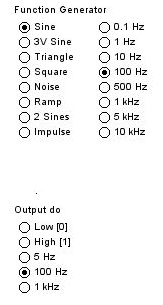
Signal Signal line do is a digital output generated by the scope hardware. do can be selected to produce high, low, 5Hz, 100Hz, or 1000Hz square waves.
Function generator Signal line Fn is an analog output between +5V and -5V. Fn cab be selected to produce a bipolar sine wave, a 0-3V sine wave, a triangle wave, bipolar square wave, noise, bipolar ramp, a sine wave with two frequencies, and a 0.5% duty cycle impulse.
Keystrokes Most of the available keystrokes are marked on the corresponding radio button. Some that aren't are these:
- P to write an image of the screen to a .png file
- X to export all the trace data presently on the screen to a .txt file that can be read by Excel or Matlab
- Q to pause the scope hardware and quit the program.
Version compatibility and USB communication bandwidth At the top of the screen is the version number of the software that runs on your Mac or PC (e.g. nuScope v2-0 2011-09-20) and also a version number that is read from the scope hardware, telling the version number of the firmware installed there (e.g. firmware v.2). If the PC/Mac version is incompatible with the scope firmware, they may not work together.
The time shown (e.g. 81.8 seconds) is the number of seconds that the scope hardware has been powered up. kBps is present data rate from the scope hardware to the Mac/PC, in kilobytes per second. Excessive data rates may crash the Mac/PC. The rate is limited by the variable USBrate in the Mac/PC software, and you can change this if necessary. USBrate=20000 is a good limit value. Higher limits allow higher number of sweep refreshes per second.
Power supply The nuScope unit provides power supply "rail" voltages for your circuits: +5V and -5V with respect to ground, at up to about 100mA. Blue and red LEDs indicate the +5V and -5V rails; green LEDs indicate the G (ground) rails. The color stripes on your solderless breadboard won't necessarily correspond to the LED colors; trust the LEDs. The LED colors tell you which supply voltage each rail carries.
A pushbutton toggles the power supply on and off. If you exceed the current capability of the supply, it will turn off (red and blue LEDs will go out and the green LEDs will alternately flash). You can reset it with the pushbutton, unless it is is still overloaded. If the current capability is vastly exceeded, the red and blue LEDs will go out and the green LEDs will flash together. The only way to reset in this scenario is to close the software, unplug the USB cable and plug back in, and reopen the software.
You can also toggle the power supply on and off from the screen. A bar graph shows the power consumption of the DCDC converter used to produce the rail voltages. When the power consumption becomes excessive, and before the DCDC converter overheats or the computer shuts off USB power, the power supply will be turned off.
Plugging in to a solderless breadboard
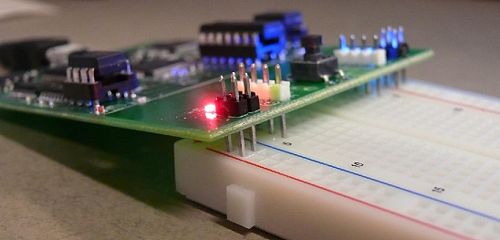
Plug your nuScope unit into solderless breadboard as far toward one end as you can, to maximize the working space you have left. It's best if you get the red-striped edge of the breadboard at the left as shown in the photo, even though this may make the numbering on the breadboard upside down. +5V, -5V, and ground prongs from the nuScope (gold in the photo) connect to the power supply rails of the breadboard (the holes that have a stripe by them). Input connections to the scope (silver in the photo) connect to testpoints that you can access, via the breadboard. You can connect signals from your circuit to the A and B analog inputs, to be displayed on your laptop, by pushing wires through the holes in the nuScope board and into the breadboard. See the yellow and red wires in the photo below.
Installing the app
- For Mac, Windows, and Linux, you first need USB serial drivers by FTDI. Download and install the FTDI Virtual Com Port VCP drivers. (Note 1: use the VCP drivers; don't change pages to the D2XX Direct drivers. Note 2: these are the same drivers the ME333 NU32 board uses, if you have installed them already you do not need to install them again.)
- Next you need the nuScope app for your platform. Download and install the NUScope ap (v2-0) (v2-1) (v2-2). (Also a for a netbook-sized screen v2-0.)
- Note: If this ap takes more than a few seconds to generate the list of available com ports, email Nick.
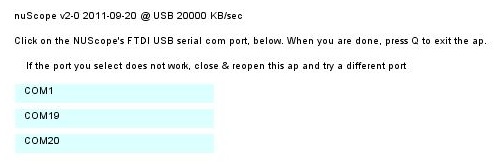
- When you run the nuScope ap it will ask you to choose the USB port that your nuScope USB device is attached to. A list of ports is shown as in the screensnap below. The correct one may be obvious or not. You can try running the app with/without the nuScope USB device attached. You should see two USB port names present/absent in the list, choose the first one.
- Click on the correct port. You only get one shot at this: if you choose the wrong one, close the app, reopen it, and try again. Once you get this right, it will probably always stay the same. In the example below, it's the second one.
- As soon as you have selected the right USB port you should see a rolling oscilloscope display begin.
- Hit the Q key to exit the app.
If you select the correct port and everything works, you should see a moving trace, or, if the power supply is off, you will see a red "flat line" graph instead. Don't worry about the waveform; you should see motion.
Testing your nuScope
- Cut and strip the ends of a wire and place it across Fn and A. Select a Continuous sweep, and Trigger/rising. Use a 5mS/div sweep rate.
- Under Function Generator, select Sine and 100Hz. Click inside the Analog A window to set the Trigger level, somewhere between -2V and 2V. You should see a 100Hz sine wave.
- Press the button on the nuScope and note that the sweep stops. Press the check box labeled Power Supply in the software to enable the sweep again.
- Cut and strip another wire and place it into do and D1. Change Output do to 100Hz. Click on the Digital 1 graph to set the trigger on the D1 input.
- Play with the Sweep Rate to see how you can zoom in the time scale and see more or fewer pulses.
Additional Information
NUScope PIC32 code for 2011, for v2-2
Source code for the Processing ap is in the NuScope2-0 folder.
Recording Sound with your Laptop
If you have a built in microphone, you can record a .wav file using RecordLineIn.
Press 'r' to start and stop recording, and 's' to save the .wav file in the same folder as the RecordLineIn program.
You can view the .wav file using Matlab or many other progams, such as Audacity.
In Matlab, you can load the .wav file by going to File->Import Data, and selecting the file, or using
[y, Fs, nbits] = wavread(filename);
You can listen to and view the spectra of the file if you have the Signal Processing Toolbax, opened by calling
sptool
Or you can directly plot the data, and perform the FFT using
N = length(y);
k = 0:N-1;
T = N / Fs;
freq = k/T;
Y = fft(y)/N;
cut = ceil(N/2);
Y = Y(1:cut);
freq = freq(1:cut);
figure; loglog(freq, abs(Y));
Older Versions of the nuScope
From 2010-2011: (v1-3)
