Test
Overview
The swarm robot project has gone through several phases, with each phase focusing on different aspects of swarm robotics and the implementation of the project. This entry focuses on the most recent phase of the project, covering topics such as, but not limited to, Xbee Interface Extension Boards, LED light boards, and changes made to the Machine Vision Localization System, and the overall conversion to LED boards and a controlled light environment. These entries help provide insight into setup and specific details to allow others to replicate or reproduce our results, and to provide additional information for those working on similar projects or this project at a later time. Other articles in the Swarm Robot Project category focus on topics such as the swarm theory and algorithms implemented, as well as previous phases of the project, such as motion control and consensus estimation. You may reach these articles and others by following the category link at the bottom of every page, or through this link - Swarm Robot Project.
Hardware
XBee Interface Extension Board
Previous Version
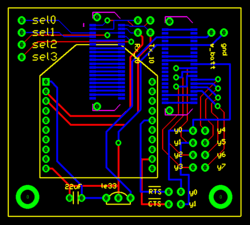
The previous version of XBee Interface Extension Board, designed by Michael Hwang.
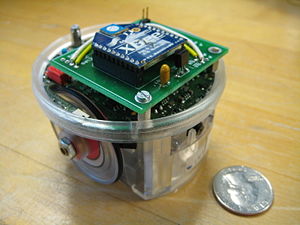
Its configuration is shown in the figure on the left, with an actual image of the board mounted on an e-Puck seen in the figure on the right. This version of XBee Board does not contain a color sensor in it. Details about this version of XBee Interface Extension Board, such as parts used and Traxmaker files can be found on the Swarm Robot Project Documentation page.
Current Version
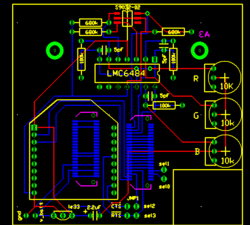
The upgraded version of XBee Interface Extension Board. It is designed by Michael Hwang. This version has a color sensor circuit built in. The details of the color sensor circuit can be found in the color sensor section below.
The RTS flow control line on the XBee is connected to the sel3 line of the e-puck. Although the CTS line is not connected to the sel2 pin in this board design, it can be easily connected with a jumper.
This new version of XBee Interface Extension Board design was actually built and implemented on the e-puck # 3. In order to see if there is any working problem in this board design, it is first tested with the other e-puck which uses the previous XBee Boards.
The e-puck # 3 upgraded with the new XBee board did not show any problem in communicating with other e-pucks. According to the goal defined, all e-pucks, including e-puck # 3, locate themselves to the desired location.
Color Sensor Circuit
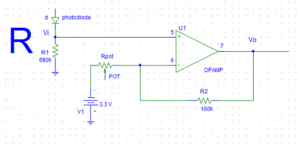
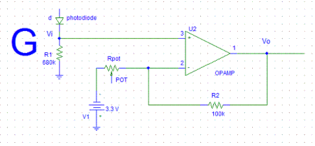
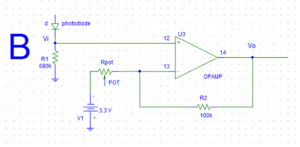
As you may draw from the circuit diagrams above, as each photodiode receives light, a certain amount of current start to flow through the photodiodes and generates a voltage across R1 = 680K. Each photodiode is designed to detect the certain range of wavelength of the light, and the amount of current flowing through the photodiodes is determined according to the amount of the corresponding light to each photodiode. The op-amp (LMC6484) takes the voltage generated across R1 as the input signal, amplifying it by a ratio particular to the circuit. This ratio is also known as gain, and is defined by resistance of the potentiometer. The now amplified output is then sent to the analog digital converter, which on the e-Puck had been used as the X,Y, and Z axis accelerometers. This convenient, as each accelerometer axis can be used as a channel for the color sensors three colors. The converted signal can then be used to measure the response of the color sensor to light. The corresponding equation for the circuits illustrated above are as follows:
- Rpot = resistance of the potentiometer (shown in the diagram)
- R2 = 100K (shown in the diagram)
- Vi = voltage across R1 = 680K, which the op-amp takes as an input
- Vo = output signal amplified from the op-amp
The gain of the color sensor circuits is approximately 20. Thus, the input voltage, Vi, is amplified to be 20Vi, which is Vo. As mentioned above, the gain can be adjusted properly by controlling the resistance of the potentiometer.
As shown in the circuit diagram on the left, the siganl from the red photodiode goes into the pin #5, and the amplified signal is sent out through the pin # 7. Similarly, the signal from the green photodiode goes into the pin #3 and it is sent out from pin #1 while the signal from the blue photodiode goes into the pin #12, and it is sent out from pin #14.
Output Pins
- Pin #7 - Amplified Red photodiode signal
- Pin #1 - Amplified Green photodiode signal
- Pin #14 - Amplified Blue photodiode signal
Parts used
Parts used in both the previous version and the new version of XBee Interface Extension Board
- 2x 10 pos. 2 mm pitch socket (Digikey S5751-10-ND)
- LE-33 low dropout voltage regulator (Digikey 497-4258-1-ND)
- 2.2uF tantalum capacitor (Digikey 399-3536-ND)
- 2x Samtec BTE-020-02-L-D-A (Order directly from Samtec)
- 0.1"header pins for RTS and CTS pins (you can also use wire for a permanent connection)
- 2x 0.1" jumpers for connecting RTS and CTS pins if you used header pins(Digikey S9000-ND)
Additional parts for new version of XBee Interface Extension Board
- 3x 100K resistors
- 3x 680K resistors
- 3x 10K potentiometer
- 3x 5pF capacitor
- 1x RGB color sensor (Order directly from HAMAMATSU, part#:s9032-02, Datasheet)
- 1x High impedence op-amp LMC6484
Future modifications
As mentioned in the overview, the black dot patterns of e-pucks are replaced with new LED patterns by implementing LED pattern board at the top of each e-puck. Thus, in order for the color sensor to collect data properly, it is necessary to move the color sensor from the XBee Interface Extension Board to the LED pattern board so that nothing will block the color sensor. All other components for the color sensor circuit remains in the XBee Interface Extension Board and only the color sensor will be place in the LED pattern board. We can use a jumper to connect the color sensor placed at the LED pattern board to the color sensor circuit place in the XBee Interface Extension Board. The datails of this LED pattern Board will be presented at the section below.
LED Pattern Board
This new LED pattern board is introduced for the Swarm Robot Project. Currently, the unique black dot pattern of each e-puck was used for the machine vision system to recognize each e-puck. However, this black dot pattern requires a white background in order for the machine vision system to recognize e-pucks. The new LED pattern board uses LEDs with the proper brightness, instead of the black dot pattern. By doing so, the machine vision system can now recoginize e-pucks on any background. The reason why this LED pattern is recognized on any background will be presented briefly in the Code section below. In addition, in order to apply this LED pattern to the machine vision system, we made a modification in code. This modification will also be presented in the Code Section below. The PCB file can be downloaded here: Media:LED_Pattern_Board.pcb
LED Pattern Board Design
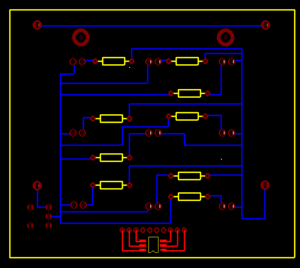
This LED Pattern Board is created using Traxmaker. This LED Board design can be downloaded here: Although we replaced the black dots with LEDs, we maintain each pattern of dots. The horizontal distance and the vertical distance between the two adjacent LEDs are both 0.8 inch. In order to reduce power consumption of the e-puck battery, we implement a seperate pair of AAA batteries to supply power to the LEDs. This LED board can be turned on and off by the switch. The milicandela rating of the LEDs used is 4850 mcd. In addition, this LED has diffused lens style. The reason to choose this LED is that it has a proper brightness and power consumption, and it is diffused so that the machine vision system can capture this LED in any places.The resistor used are 68.7 ohm.
As mentioned in the XBee Interface Extension Board section, the color sensor has to be moved to this LED pattern board from the XBee Interface Extension Board so that nothing blocks the sensor. Thus, as you can see in the Figure on the left, the color sensor is place at the front, and each photodiode is connected to the 10 pin header. This header connects the color sensor on the LED pattern board to the remaining part of color sensor circuit on the XBee Interface Extension Board.
Parts used
- 3x LED (Digikey 516-1697-ND): Some e-pucks require 4 LEDs since they have a pattern composed of 4 dots
- 3x 68.7 ohm resistors : Some e-pucks require 4 resistors since they have 4 LEDs
- 2x AAA Battery Holder (Digikey 2466K-ND)
- 1x Switch (Digikey CKN1068-ND)
- 1x RGB color sensor (Order directly from HAMAMATSU, part#:s9032-02)
- 1x 10 pos. 2 mm pitch socket (Digikey S5751-10-ND)
Tests
LED Distance vs Color Sensor Signal
Tests need be done in order to note the affect of the LED light on the color sensor due to potential interference. The first experiment performed is designed to see how much interference will be caused as the distance between the LED and the color sensor changes.
Setup and Results
1. A white LED is used in this experiment because the white LED will cover the entire wavelengh ranges of the visible light. The experiment with the white LED can yield a general result, while the experiment with the colored LEDs will yield more specific result focused on the interference between the certain photodiode and the certain color.
- LED: 18950 mcd (millicandela), digikey part number: C503B-WAN-CABBB151-ND
2. The experiment was performed under the two conditions; with the ambient light and without the ambient light.
3. The LED and the color sensor were placed at the same plane, and both are facing upward.
4. Distance between the color sensor and the LED is increased by 0.25 inch each time from 1 inch to 2.5 inch.
5. The amplified output, Vo as shown in the circuit diagram above, of each photodiode is measured.
With Ambient light
- Unit: Volt, V
| Distance | R | G | B |
|---|---|---|---|
| No LED | 1 | 1.4 | 0.469 |
| 1 inch | 1.259 | 1.716 | 0.832 |
| 1.25 inch | 1.185 | 1.619 | 0.757 |
| 1.5 inch | 1.135 | 1.529 | 0.669 |
| 1.75 inch | 1.097 | 1.503 | 0.613 |
| 2 inch | 1.086 | 1.481 | 0.589 |
| 2.25 inch | 1.071 | 1.47 | 0.563 |
| 2.5 inch | 1.06 | 1.453 | 0.546 |
Without the Ambient Light
- Unit: Volt, V
| Distance | R | G | B |
|---|---|---|---|
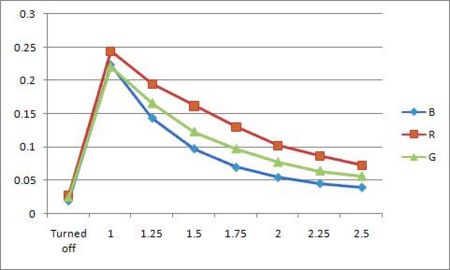
| No LED | 0.028 | 0.025 | 0.019 |
| 1 inch | 0.244 | 0.221 | 0.223 |
| 1.25 inch | 0.195 | 0.166 | 0.143 |
| 1.5 inch | 0.162 | 0.123 | 0.097 |
| 1.75 inch | 0.130 | 0.097 | 0.069 |
| 2 inch | 0.102 | 0.077 | 0.054 |
| 2.25 inch | 0.087 | 0.064 | 0.045 |
| 2.5 inch | 0.073 | 0.056 | 0.039 |
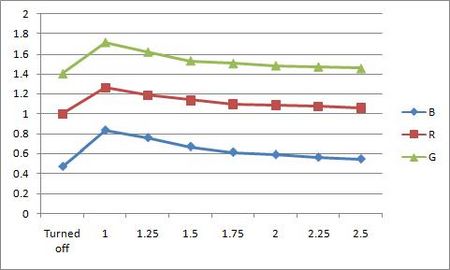
As you can see in the two graphs above, the color sensor is affected by the light from the LED. The color sensor is most affectd by the LED when the LED is closest to it. As the distance between the LED and the color sensor increases, the interference decreases. When the color sensor is most affected by the LED under the presence of the room light, the output increases up to 25.9%, 22.6%, and 43.6 % of the original output. As the LED is 2.5 inch away from the color sensor, the output becomes very close to the original value.
In this experiment, we see that the lights from LEDs can affect the color sensor. However, we used much brighter LED in this experiment than the ones we use in the LED pattern board. The brightness of the LED used in the experiment is 4 times larger than the ones in the LED pattern board. Thus, more experiment with the LEDs used in the LED pattern board is required.
LED Angle vs Color Sensor Signal
The second experiment is designed to see how much interference will be caused as the angle between LED and color sensor changes. Different from the first experiment, Vi, the voltage before amplified, is mesured since amplified output, Vo, easily reaches to the maximum.
Setup and Results
1. A white LED is used again in this experiment with the same reason above for the first experiment.
- LED: 18950 mcd, Digikey part number: C503B-WAN-CABBB151-ND
2. The experiment was performed under the two conditions; with the ambient light and without the ambient light.
3. In this experiment, the distance between LED and color sensor is kept constant, 1 inch.
4. Angle between LED and color sensor is increased by 15º each time from 0º to 90º.
When the angle is 0º, the LED and the color sensor is placed at the same horizontal plane. The LED is facing toward the color sensor(this means that the LED is parallel to the horizontal plane with its head facing the color sensor, which is placed on the same horizontal plane), and the color sensor is facing upward. We increased the angle by 15º each time, and increasing amounts of light from the LED shines onto the color sensor. When the angle is 90º, the LED is right above the color sensor, facing the color sensor directly. This means that the LED and the color sensor are now on the same vertical line, and the LED is facing downward.
5. The voltage before amplified, Vi as shown in the circuit diagram above, of each photodiode is measured.
- The reason to measure the volatage before amplified is that the output becomes too large after amplified.
With the Ambient Light
- Unit: Volt, V
| Angle | R | G | B |
|---|---|---|---|
| 0º | 0.437 | 0.425 | 0.404 |
| 15º | 0.475 | 0.470 | 0.451 |
| 30º | 0.490 | 0.491 | 0.501 |
| 45º | 0.505 | 0.506 | 0.520 |
| 60º | 0.484 | 0.468 | 0.484 |
| 75º | 0.457 | 0.453 | 0.440 |
| 90º | 0.439 | 0.430 | 0.408 |
Without the Ambient Light
- Unit: Volt, V
| Angle | R | G | B |
|---|---|---|---|
| 0º | 0.446 | 0.436 | 0.416 |
| 15º | 0.454 | 0.491 | 0.461 |
| 30º | 0.493 | 0.505 | 0.480 |
| 45º | 0.512 | 0.521 | 0.520 |
| 60º | 0.498 | 0.486 | 0.491 |
| 75º | 0.498 | 0.492 | 0.487 |
| 90º | 0.485 | 0.479 | 0.515 |
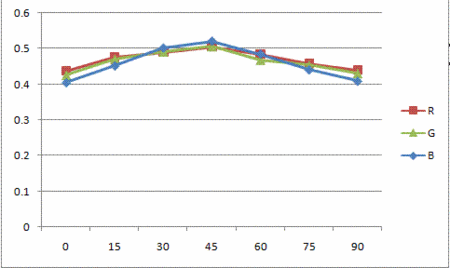
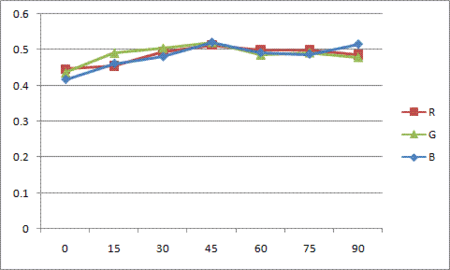
As the first experiment, two graph above shows that the color sensor is affected by the light from the LED. The color sensor is most affectd by the LED when the angle between two is 45º. The inteference increases as the angle goes to 45º, and reaches to the peak at 45º. Then it decreases as the angle goes to 90º. When the color sensor is most affected by the LED under the presence of the room light, the output increases upto 15.6%, 19.1%, and 28.7% of Vi. As angle becomes 90º, the output becomes very close to the value at the angle of 0º. The reason why the interference is reduced as the angle reaches 90º is that the ambient light presented are blocked by the LED board. When we perform this experiment, the LEDs are implemented on the LED plane. This LED plane blocks the light and make a shadow on the color sensor. Thus, the amount of light that the color sensor receives decreases. That is why the output becomes close to its original value while the angle increases.
Next Steps
The LED Pattern Board design above needs to be modified in the following parts.
- The hole size for the LEDs has to increase so that it can accomodate the standoff of the LED chosen.
- The hole size for the switch has to increase so that the switch can be completely inserted through the hole.
- Currently, 10 pos 2mm pitch socket is used to connect the color sensor to the circuit using wires. Instead, the proper header for the color sensor has to be found to connect the color sensor and the circuit more conveniently.
Machine Vision Localization System Modification
The Machine Vision Localization System takes the real (color) image from the four cameras, and converts it into a grey-scale image. Then, using a threshold set in the machine vision code, the grey-scaled image is divided into black and white, and this black and white image is presented on the machine vision system computer screen. With the current set-up, the white background on the floor is presented as black, and black dot patterns on e-pucks are presented as white patterns. The system recognizes theses white dot patterns and identify e-pucks, and broadcasts the position coordinates to each e-puck via the Xbee Radio. For more information about the theory and operation of the system, look through the Machine Vision Localization System article.
However, there is a problem with using black dot patterns to identify e-pucks. Since the machine vision system and code use a preset threshold to divide the grey image into black and white, black dot patterns are affected by the background color due to lack of contrast. For instance, if the background is black, or any color besides white, the system would have a difficult time distinguishing the pattern from the background, and possible not capture them at all. In addition, other problems arise from dirt and debris tracked onto the white surface of the floor, resulting in false patterns, further throwing the system.
A solution is to substitute the black dots with LEDs placed atop the e-pucks, allowing the machine vision system to capture the identification pattern clearly regardless of background color and condition. By adjusting the threshold set in the machine vision code, the system will rely on the contrast of light intensity, minimizing the interference of the operating environment whose light intensity is which is naturally weaker than LEDs'.
Compatibility Problem of Original Code with LEDs
With the original code implementation, the system could not recognize LED patterns on e-puck; it only recognizes white patterns on the screen, which are black patterns in the reality. This problem can be simply fixed with modifying code to make the system capture LED patterns and present them as white patterns on the screen. The change of program will be shown in the next section. With this change, the system now makes LED patterns white dot patterns on the screen, so it can recognize them and identify e-pucks.
Change from Original Code
In main.cpp in VisionTracking project, the code has been changed in
Line 48:

cvThreshold(greyImage[camerai], thresholdedImage[camerai], threshold, 255, '''CV_THRESH_BINARY_INV''');

to

cvThreshold(greyImage[camerai], thresholdedImage[camerai], threshold, 255, '''CV_THRESH_BINARY''');
and
Line 735:

cvThreshold(grey, thresholded_image, threshold, 255, CV_THRESH_BINARY_INV);

to

cvThreshold(grey, thresholded_image, threshold, 255, CV_THRESH_BINARY);
Also, in global_vars.h,
Line 65:

double threshold = 75;   //black/white threshold

to

double threshold = 200;   //black/white threshold
As change CV_THRESH_BINARY_INV in both line 48 and 735 to CV_THRESH_BINARY and adjust the value of threshold from 75 to 200, the system now clearly presents LED patterns as white dot patterns on the screen, so it can identify e-pucks according to LED patterns.
Further Threshold Testing
The threshold value of 200 is determined to be good enough for the test inside. With various conditions, however, the threshold value can, or should, be changed more properly. In addition, the results for different range of threshold under the same test condition is presented below:
| Range | Result |
|---|---|
| 0 - 94 | System cannot caputure LED patterns at all; whole screen is white. |
| 95 - 170 | System can recognize the pattern but it is unstable, since most of background becomes white. |
| 171 - 252 | System cleary captures and recognizes LED patterns. |
| 253 | System can recognize the pattern but it is unstable since pattern is too small; stronger intensity is required. |
| 254 - 255 | System cannot caputure LED patterns at all; whole screen is black. |
An e-puck was fitted with a LED pattern board and then tested with the machine vision localization system. With the changes implemented, the machine vision localization system did not show any problems, showing the ability to capture and locate the e-puck located in anywhere in the field of vision of the cameras. In addition, the vision system was able to capture and locate the e-puck as it moved. There was no loss of positional accuracy as compared to previous implementations of identification systems. The recognition of the e-puck by the machine vision localization system displayed the stability of the LED boards with the vision system, further supporting their implementation for further experiments.
Additional Considerations
While there do not need to be any additional changes to the set up of the machine vision localization system, there may be additional considerations for further development. One such consideration is the 'background', or floor material, of the setup. With the modified machine vision code, light intensity is what is picked up and filtered by the system, thus rendering the LEDs from the e-pucks to be the only tracked objects. However, with more advanced set ups, such as one featuring light that is projected onto the background, this may present a problem with the machine vision system picking up reflected light. More testing has to be done with modifying the machine vision system threshold to see if there is an ideal threshold to accommodate this setup. Another option may be to use a non-reflective or matte surface for the background.
Another consideration involves the hardware of the setup, or the themselves. The cameras are equipped with the Logitech software which automatically adjusts the exposure and light contrast settings to correct for poor lighting and setup conditions. However, this leads to issues as with increased exposure (due to light blocking set up) and bright LEDs results in blurry or blobby images received. The machine vision localization system cannot read these images, and as a result cannot track the e-pucks. One potential solution may be to adjust the threshold of the vision system. Other solutions may be to use less intense or bright LEDs, or increase the background lighting of the setup, for instance with upward casting lights.
Conclusion
The new XBee Interface Extension Board design was tested, and we found out that it does not have any problem. In addition, the black dot pattern of the e-pucks are upgraded to LED patterns. The advantage of this improvement is that the machine vision system can recoginize each e-puck no matter where the e-pucks are located. The color of the background also does not affect the vision system. However, we had to move the color sensor to the LED pattern board since the LED pattern board will block the sensor if the sensor is located in the XBee Interface Extension Board. Thus, we now consider the light interference between the LEDs and the color sensor. In the light interference test, we found out that the color sensor is affected by the light from LED. However, since we used much brighter LEDs in our light interference test than the LEDs used for the LED pattern board, we have to do more experiment on this in order to have more accurate interference data.
