Difference between revisions of "PIC MCUs: Software"
m (→Debugger Tools) |
|||
| (21 intermediate revisions by the same user not shown) | |||
| Line 1: | Line 1: | ||
The CCS C Windows IDE is a software package that includes a source code editor, a C compiler, and an interface with a programming device (such as the ICD-U40). Together, these three components make up an Integrated Development Environment, or IDE. The general purpose of the IDE is to allow the user to create and edit a source code in C, then compile and program that code into a PIC microcontroller. |
The CCS C Windows IDE is a software package that includes a source code editor, a C compiler, and an interface with a programming device (such as the ICD-U40). Together, these three components make up an Integrated Development Environment, or IDE. The general purpose of the IDE is to allow the user to create and edit a source code in C, then compile and program that code into a PIC microcontroller. |
||
<b>Install and Setup</b> |
|||
Installing the CCS C Windows IDE is quite straightforward. Simply run the setup file from the C Compiler installation disk, and follow the on screen instructions. At a certain point in the installation, the installer will request a directory to be used for program storage. The default will be C:\Program Files\PICC\Projects , however you may wish to change this depending on where you would like your projects to be stored. |
Installing the CCS C Windows IDE is quite straightforward. Simply run the setup file from the C Compiler installation disk, and follow the on screen instructions. At a certain point in the installation, the installer will request a directory to be used for program storage. The default will be C:\Program Files\PICC\Projects , however you may wish to change this depending on where you would like your projects to be stored. |
||
| ⚫ | |||
| ⚫ | |||
The basic process taken when developing and programming in Windows IDE follows a few steps. First, a source code is created using [[C programming]] language. Next, using the ''Compile'' button (in the Compile Menu) a number of different files are created, including a .hex file which is used directly to program the MCU. Finally, the .hex file is loaded onto the MCU using the ''Program Chip'' button (also in the Compile Menu). |
The basic process taken when developing and programming in Windows IDE follows a few steps. First, a source code is created using [[C programming]] language. Next, using the ''Compile'' button (in the Compile Menu) a number of different files are created, including a .hex file which is used directly to program the MCU. Finally, the .hex file is loaded onto the MCU using the ''Program Chip'' button (also in the Compile Menu). |
||
Although the programming done in the Windows IDE is done by directly editing only the source file, many other files will be generated upon compiling the source file. All of these files will be saved into the same directory as the source file, and will have the same name (with different file extensions). A list of file extensions and their |
Although the programming done in the Windows IDE is done by directly editing only the source file, many other files will be generated upon compiling the source file. All of these files will be saved into the same directory as the source file, and will have the same name (with different file extensions). A list of file extensions and their significance is given below. |
||
| ⚫ | |||
<br> |
<br> |
||
{| border="1" cellspacing="2" cellpadding="3" align="center" |
{| border="1" cellspacing="2" cellpadding="3" align="center" |
||
|- |
|- |
||
!Extension!! |
!Extension!! Significance |
||
|- |
|- |
||
|.c || Source code file |
|.c || Source code file |
||
| Line 36: | Line 40: | ||
|} |
|} |
||
| ⚫ | |||
<b>Debugging</b> |
|||
As the name suggests, the ICD-U40 is an "'''I'''n '''C'''ircuit '''D'''ebugger", which allows the Windows IDE to connect with the MCU and control the running of the programmed MCU via the debugger window. This tool is extremely useful, as it allows the user to follow the execution of code on a step-by-step basis in order to work out any errors. |
As the name suggests, the ICD-U40 is an "'''I'''n '''C'''ircuit '''D'''ebugger", which allows the Windows IDE to connect with the MCU and control the running of the programmed MCU via the debugger window. This tool is extremely useful, as it allows the user to follow the execution of code on a step-by-step basis in order to work out any errors. |
||
| ⚫ | |||
| ⚫ | |||
| ⚫ | |||
| ⚫ | |||
To use the debugger, first verify that the hardware (ICD-U40 and PIC MCU) is [[Hardware and Connections|connected properly]]. In order to allow the IDE to enter into debug mode, you must have the following in your code: |
|||
#device ICD=TRUE |
|||
| ⚫ | Without the above section of code, the debugger will display a warning instructing you to include it. You can chose to enter debug mode once the warning is displayed, but to avoid it all together, use the above chunk of code. Once that is set, the ''Enable Debugger'' button in the Debug Menu will automatically compile your source code, load the code onto the MCU, and enter into debug mode. This will open a debug window where all of the commands for debugging are displayed. |
||
| ⚫ | |||
The main toolbar in the debug window is at the top, and is shown below, both while stopped and while running. |
The main toolbar in the debug window is at the top, and is shown below, both while stopped and while running. |
||
<br> |
<br> |
||
[[Image:debugmenu1.jpg||left]][[Image:debugmenu2.jpg]] |
[[Image:debugmenu1.jpg||left]][[Image:debugmenu2.jpg]] |
||
<br> |
<br> |
||
<br> |
|||
These are the basic tools of the debugger. The ''Run'' and ''Stop'' buttons will start and halt the execution of the program, and the ''Reset'' button reloads the code, as it did when the debugger was initially enabled. The ''Step Over'' and ''Step Into'' buttons are very useful in debugging, as they allow the user to step through their program and watch how it progresses. The ''Step Into'' button will execute one line of source code every time it is pressed. The ''Step Over'' button works in much the same way, only when a function call is encountered, it will step through the entire function rather than the function's individual steps. |
These are the basic tools of the debugger. The ''Run'' and ''Stop'' buttons will start and halt the execution of the program, and the ''Reset'' button reloads the code, as it did when the debugger was initially enabled. The ''Step Over'' and ''Step Into'' buttons are very useful in debugging, as they allow the user to step through their program and watch how it progresses. The ''Step Into'' button will execute one line of source code every time it is pressed. The ''Step Over'' button works in much the same way, only when a function call is encountered, it will step through the entire function rather than the function's individual steps. The ''Run to Cursor'' button will run the program until it reaches the point where your cursor is in the source code window. Clicking the ''Snapshot'' button will open a window where certain details about the current state of the system can be selected to be saved in a text file, or sent to a printer. |
||
<b>Watches</b> |
|||
[[Image:watchtab.jpg||right]] |
|||
Another quite useful capability of the Windows IDE debugger is setting and checking watches. In the debug window there is a tab titled ''Watches'' that will look like the picture to the right. A watch functions to provide a value for a certain variable as it changes throughout the course of running the program. If you are stepping through a program, the watch tab will display a value for each variable after each step. If you are running the program, the watch tab will display a value for each variable once the program has been halted. |
|||
<br> |
|||
<br> |
|||
To set a watch, click on the '''+''' symbol and select the variable to be watched from the drop-down menu labelled "Variables in scope at cursor location", or type in the name of the variable (in correct C syntax). |
|||
| ⚫ | |||
Apart from specific uses of the Windows IDE, there are a lot of little details that make working with it easier. This section details a few. |
|||
<b>Cursor-Over Reading</b> |
|||
In debug mode, if the cursor is held over a variable in the source code window, the value of that variable will be displayed. This is akin to reading a watch. |
|||
<b>Open Files at Cursor</b> |
|||
When outside files are referenced in a source code (header files, etc.) the cursor can be placed on any part of the file name, and right clicking will give the option to "open file at cursor". This will open the selected file in a new tab in the Windows IDE. |
|||
<b>Datasheets</b> |
|||
Along with installing the IDE itself, the installation disk included a library of PIC microcontroller datasheets. Right clicking in the source code window will give the option to "view datasheet". Clicking this will open a window where the specific PIC microcontroller can be specified, and the datasheet can be opened. This window can also be reached by clicking the ''Datasheet'' button in the View menu. The .pdf file will open in a new window. |
|||
<b>Valid Fuses and Interrupts</b> |
|||
Also in the View menu are two buttons: ''Valid Fuses'' and ''Valid Interrupts''. These buttons will open new windows that show all of the possible interrupts and fuses for the specific PIC microcontroller. |
|||
<b>References</b> |
|||
| ⚫ | |||
''PIC MCU C Compiler Reference Manual'', Custom Computer Services, Inc., 2006. |
|||
Latest revision as of 18:50, 26 December 2007
The CCS C Windows IDE is a software package that includes a source code editor, a C compiler, and an interface with a programming device (such as the ICD-U40). Together, these three components make up an Integrated Development Environment, or IDE. The general purpose of the IDE is to allow the user to create and edit a source code in C, then compile and program that code into a PIC microcontroller.
Install and Setup
Installing the CCS C Windows IDE is quite straightforward. Simply run the setup file from the C Compiler installation disk, and follow the on screen instructions. At a certain point in the installation, the installer will request a directory to be used for program storage. The default will be C:\Program Files\PICC\Projects , however you may wish to change this depending on where you would like your projects to be stored.
Project Basics The basic process taken when developing and programming in Windows IDE follows a few steps. First, a source code is created using C programming language. Next, using the Compile button (in the Compile Menu) a number of different files are created, including a .hex file which is used directly to program the MCU. Finally, the .hex file is loaded onto the MCU using the Program Chip button (also in the Compile Menu).
Although the programming done in the Windows IDE is done by directly editing only the source file, many other files will be generated upon compiling the source file. All of these files will be saved into the same directory as the source file, and will have the same name (with different file extensions). A list of file extensions and their significance is given below.
| Extension | Significance |
|---|---|
| .c | Source code file |
| .cof | Binary machine code file |
| .err | Listing and description of any errors |
| .esym | IDE file containing comment information and definitions from header file |
| .hex | Programmable output file compatible with all programmers |
| .lst | Line by line listing of source code along with generated assembly code |
| .pjt | Main project file |
| .sta | Memory usage summary (statistics) |
| .sym | List of symbols used and their corresponding registers |
| .tre | Shows every function used in the source code, and the memory used by each |
Debugging As the name suggests, the ICD-U40 is an "In Circuit Debugger", which allows the Windows IDE to connect with the MCU and control the running of the programmed MCU via the debugger window. This tool is extremely useful, as it allows the user to follow the execution of code on a step-by-step basis in order to work out any errors.
Starting the Debugger To use the debugger, first verify that the hardware (ICD-U40 and PIC MCU) is connected properly. In order to allow the IDE to enter into debug mode, you must have the following in your code:
#device ICD=TRUE
Without the above section of code, the debugger will display a warning instructing you to include it. You can chose to enter debug mode once the warning is displayed, but to avoid it all together, use the above chunk of code. Once that is set, the Enable Debugger button in the Debug Menu will automatically compile your source code, load the code onto the MCU, and enter into debug mode. This will open a debug window where all of the commands for debugging are displayed.
Debugger Tools
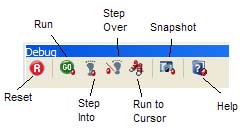
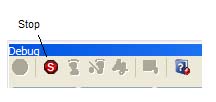
The main toolbar in the debug window is at the top, and is shown below, both while stopped and while running.
These are the basic tools of the debugger. The Run and Stop buttons will start and halt the execution of the program, and the Reset button reloads the code, as it did when the debugger was initially enabled. The Step Over and Step Into buttons are very useful in debugging, as they allow the user to step through their program and watch how it progresses. The Step Into button will execute one line of source code every time it is pressed. The Step Over button works in much the same way, only when a function call is encountered, it will step through the entire function rather than the function's individual steps. The Run to Cursor button will run the program until it reaches the point where your cursor is in the source code window. Clicking the Snapshot button will open a window where certain details about the current state of the system can be selected to be saved in a text file, or sent to a printer.
Watches
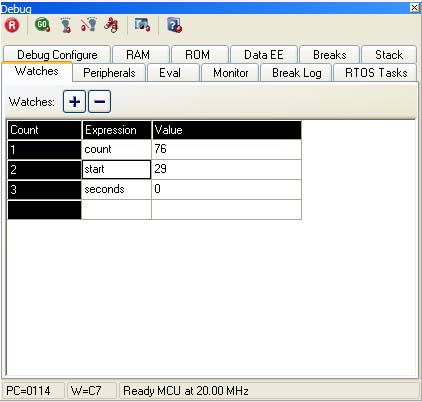
Another quite useful capability of the Windows IDE debugger is setting and checking watches. In the debug window there is a tab titled Watches that will look like the picture to the right. A watch functions to provide a value for a certain variable as it changes throughout the course of running the program. If you are stepping through a program, the watch tab will display a value for each variable after each step. If you are running the program, the watch tab will display a value for each variable once the program has been halted.
To set a watch, click on the + symbol and select the variable to be watched from the drop-down menu labelled "Variables in scope at cursor location", or type in the name of the variable (in correct C syntax).
Windows IDE Details Apart from specific uses of the Windows IDE, there are a lot of little details that make working with it easier. This section details a few.
Cursor-Over Reading
In debug mode, if the cursor is held over a variable in the source code window, the value of that variable will be displayed. This is akin to reading a watch.
Open Files at Cursor
When outside files are referenced in a source code (header files, etc.) the cursor can be placed on any part of the file name, and right clicking will give the option to "open file at cursor". This will open the selected file in a new tab in the Windows IDE.
Datasheets
Along with installing the IDE itself, the installation disk included a library of PIC microcontroller datasheets. Right clicking in the source code window will give the option to "view datasheet". Clicking this will open a window where the specific PIC microcontroller can be specified, and the datasheet can be opened. This window can also be reached by clicking the Datasheet button in the View menu. The .pdf file will open in a new window.
Valid Fuses and Interrupts
Also in the View menu are two buttons: Valid Fuses and Valid Interrupts. These buttons will open new windows that show all of the possible interrupts and fuses for the specific PIC microcontroller.
References
PIC MCU C Compiler Reference Manual, Custom Computer Services, Inc., 2006.


