Difference between revisions of "Flexure Characterization and Design"
Philip Dames (talk | contribs) |
Philip Dames (talk | contribs) |
||
| (31 intermediate revisions by the same user not shown) | |||
| Line 1: | Line 1: | ||
[[image:flexure_test_straight.jpg|thumb|300px|Flexure Test]] |
|||
=Overview= |
=Overview= |
||
[[image:Current_flexure.jpg|thumb|300px|Current Flexure|left]] |
|||
Flexures are deformable solid bodies used to connect elements in a mechanical system. This flexibility allows for greater freedom of motion of the parts relative to each other than a rigid joint does, but at the cost of complicating the dynamics of the system. As one can imagine, it is important to know the properties of the flexures in order to predict and control the behavior of a system. This project is primarily focused on the flexures used in the PPOD projects in LIMS which are used to connect the linear actuators to the table. In this case the flexures allow the table to move in all six degrees of freedom (three translational and three rotational) which the use of rigid joints would not allow. The goals of this project are to be able to test the performance of the existing flexures and to use this information to design new ones to improve the performance of the PPOD. |
Flexures are deformable solid bodies used to connect elements in a mechanical system. This flexibility allows for greater freedom of motion of the parts relative to each other than a rigid joint does, but at the cost of complicating the dynamics of the system. As one can imagine, it is important to know the properties of the flexures in order to predict and control the behavior of a system. This project is primarily focused on the flexures used in the PPOD projects in LIMS which are used to connect the linear actuators to the table. In this case the flexures allow the table to move in all six degrees of freedom (three translational and three rotational) which the use of rigid joints would not allow. The goals of this project are to be able to test the performance of the existing flexures and to use this information to design new ones to improve the performance of the PPOD. The flexures currently on the PPOD are made of a 1/4" Tygon tubing glued to aluminum mounts. |
||
<br clear=all> |
|||
=Current Design= |
|||
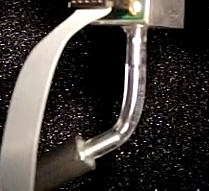
The flexures currently on the PPOD are made of a 1/4" Tygon tubing glued to aluminum mounts. |
|||
=Hardware= |
=Hardware= |
||
[[image:PPOD_flexure_test.jpg|thumb|500px|Flexure Test Setup|right]] |
|||
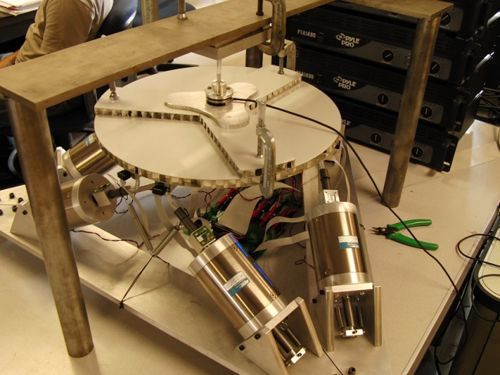
There are three basic pieces of hardware needed to characterize a flexure: a forcing mechanism that can move in all six degrees of freedom, accelerameters to collect motion data, and a six-axis force sensor to collect the forces and moments. The PPOD is used to force the flexures because it already collects acceleration data of the plate and it can control motion in all six degrees of motion at frequencies and amplitudes at which the flexures will be used. |
|||
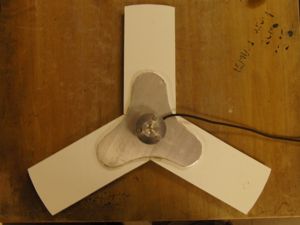
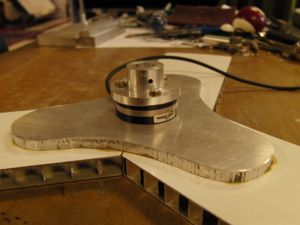
*Force Sensor mount - In order to attach the flexure and force sensor to the PPOD, we had to design a detachable mounting system. To make it light enough that the PPOD would not have much difficulty in controlling it, the arms were made from aluminum honeycomb and glued in the center to an aluminum plate where the force sensor attaches. This central plate is to make the mount more rigid as the arms are separate pieces. Three C-clamps are used to attach the mount to the PPOD plate, one at the end of each arm. The arms are aligned so that one arm points along the positive PPOD y-axis such that the force sensor cable is near the positive PPOD x-axis. |
|||
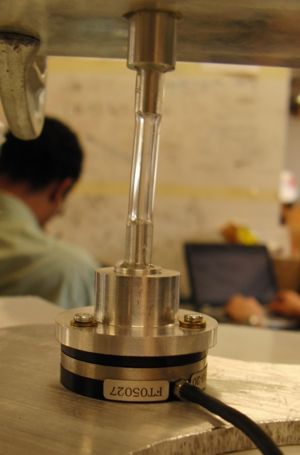
*Force Sensor - The force sensor used is an ATI Industrial Automation Mini 40 Force/Torque Sensor, model US-10-20. The data sheet can be directly seen [http://www.ati-ia.com/app_content/documents/9610-05-1017%20DAQ.pdf here] or found on [http://www.ati-ia.com/products/ft/ft_models.aspx?id=Mini40 ATI's website]. |
|||
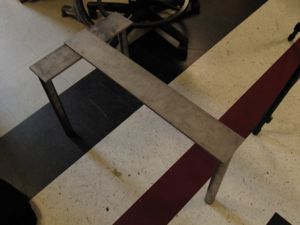
*Rigid Mount - The free end of the flexure must be mounted to a rigid body in order to measure the force the flexure is applying to the plate. This is currently a large T of steel that fits over the PPOD and the plate that the flexure is mounted to can be clamped to the bar. The height and position of the plate can be adjusted by adding spacers between the plate and the mount. |
|||
<br clear=all> |
|||
{| border="0" |
|||
|[[image:force_sensor_mount.jpg|thumb|300px|Force Sensor Mount|center]] |
|||
|[[image:force_sensor.jpg|thumb|300px|Force Sensor|center]] |
|||
|[[image:rigid_flexure_mount.jpg|thumb|300px|Rigid Flexure Mount|center]] |
|||
|} |
|||
<br clear=all> |
|||
=Data Collection= |
|||
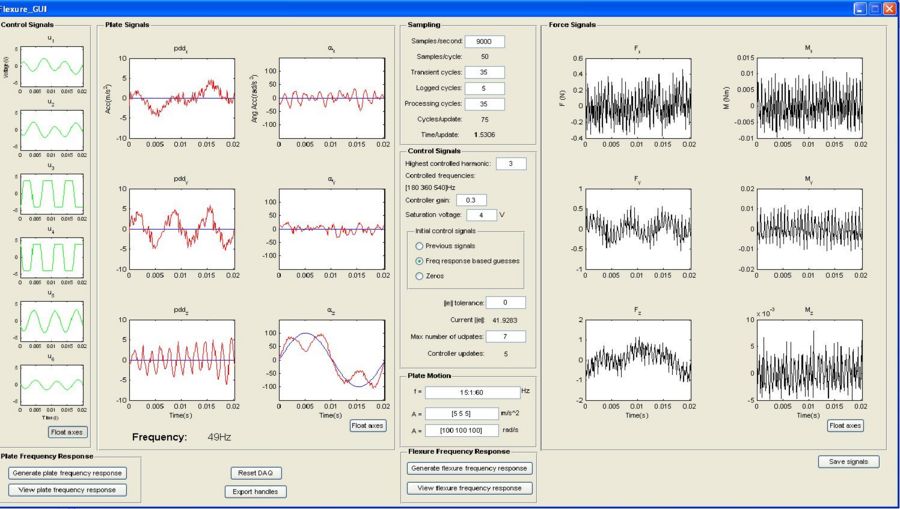
Data collection is relatively easy and is done through the Flexure_GUI shown below. This graphical user interface shows the controller information on the left side and the force sensor information the right. |
|||
[[Image:Flexure_GUI.jpg|900px|]] |
|||
*Flexure Frequency Response - This button starts the frequency test for a flexure. After the flexure is mounted and connected to the force sensor, and you have checked all the options, press this to begin. If this is the first test then the controller will ask to perform a frequency sweep, it is recommended to do so. |
|||
*Reset DAQ - This will reset the DAQ properties. Use this if the program is stopped before it finishes all of the frequency sweeps, this will reset the Sampling Data. |
|||
*Plate Motion - These are the important input parameters for flexure testing. |
|||
**f - A vector of frequencies to test the flexure at. The program sweeps through this range in one direction before moving on the to next direction. The range of usable frequencies depends on the amplitude, but for the default amplitude is 15 to 55 Hz. Above this and the controller will not be able to control plate motions. |
|||
**A - These are two vectors for the linear and angular accelerations of the plate, respectively. These have not been tested above default values for the range of usable frequencies. |
|||
*Sampling - Decreasing these will speed up computation time but may cause the program to crash if too low. |
|||
**Samples/second - Adjusts the number of samples per second. Maximum value for current DAQ hardware is around 10000 so it is recommended to stay with the default 9000. |
|||
**Transient cycles - Number of cycles to wait after a controller update before collecting data to allow for the transient response to die out. |
|||
**Logged cycles - Number of cycles to collect data. If this is increased you should also increase the transient and processing cycles to allow for the extra computation time. |
|||
**Computation cycles - Number of cycles to wait before the controller update to allow for computation time. |
|||
*Export handles - Exports the data structure with all of the information from the test. handles.flexureinfo has the tested frequencies and the complex number representing the transfer function. handles.plateinfo has the accelerations used in the test. This structure is used as the input to the flexure analysis programs found later. Save this in MATLAB using the command: |
|||
save('filename','handles') |
|||
*Force Signals - These six plots show the data collected from the force sensor during one period. The left column is for forces in the linear direction shown in N and the right column is for the moments about the coordinate axis in Nm. The high frequency noise is expected and this is filtered out by the program when it does computations. |
|||
*Controller Information - found on the left half |
|||
**Control Signals - These plots show the input voltage to each of the actuators over one period of the plate motion. Set the saturation voltage level using the text box in the central pane. Default is 4V and should never exceed 8V, especially for high amplitude driving. |
|||
**Plate Signals - These plots show the desired and actual plate motions over one period. The left column displays the linear accelerations in <math>m/s^2</math> and the right column is the angular accelerations about the coordinate axes in <math>rad/s^2</math>. Adjust the "Max Number of Updates" box in the central pane to the allow the controller to have enough time to match the match the desired response at a given frequency. |
|||
**Highest Controller Harmonic - Adjust this so the controller will control the harmonics of the input frequencies. This can help get rid of noise and give better responses. |
|||
**Controller Gain - This is the gain of the controller. Increase this to increase the response of the controller, however this should not be increased along with the saturation voltage. |
|||
**Initial Control Signals - Adjust these for different initial guesses for the control signals. |
|||
***Previous signals - Takes the last used signals as the starting point for the next response it tries to control. |
|||
***Freq response based guesses - The controller will run a sweep of the input frequencies and their harmonics to make guesses for controller signals. This is the recommended setting and will generally control the fastest. |
|||
***Zeros - This starts the controller from nothing so it will take longer to find good controller values. |
|||
**||e|| tolerance - The error tolerance. When the controller error drops below this number it means the response is "close enough" to the desired response that it can move on to the next response. |
|||
*Frequency Response - This allows the user to manually generate and view the frequency response of the system. Input a range of frequencies to test as well as the actuator voltage level to use during the sweep. |
|||
*Save Signals - This will save the controller signals, do this if the controller was working very well so it can start there later. |
|||
=Transfer Function Fitting= |
=Transfer Function Fitting= |
||
Until now, only a simple approximation has been used to describe the flexures when modeling the system. In reality, a flexure will have a mass, damping, and spring matrix associated with it that maps its motion to the forces it applies. |
Until now, only a simple approximation has been used to describe the flexures when modeling the system. In reality, a flexure will have a mass, damping, and spring matrix as well as more complicated non-linear behavior associated with it that maps its motion to the forces it applies. For now we have assumed a second-order system of the form: |
||
<math>f = M\ddot{x} + B\dot{x} + |
<math>\overrightarrow{f} = M\ddot{\overrightarrow{x}} + B\dot{\overrightarrow{x}} + K\overrightarrow{x}</math> |
||
Here <math>f = [f_x f_y f_z M_x M_y M_z]^T</math> is a vector of forces and moments |
Here <math>\overrightarrow{f} = [f_x, f_y, f_z, M_x, M_y, M_z]^T</math> is a vector of forces and moments and <math>\overrightarrow{x} = [x_x, x_y, x_z, \theta_x, \theta_y, \theta_z]^T</math> is a vector of coordinates. This leads to a transfer function from input acceleration <math>A_i</math> to output force <math>F_j</math> given by: |
||
<math>F_j(s) = \frac{M_{ji} s^2 + B_{ji} s + K_{ji}}{s^2}A_i(s)</math> |
|||
We then have to fit this model to each combination of the accelerations and forces for a total of 36 transfer functions, one for each entry in the mass, damping, and spring matrices. For this we used the MATLAB code found [[Media:flexure_test_code.zip|here]]. Read comments in the code for specific instructions on use. |
|||
Overall, this code will analyze the data output from the flexure test. It can be used to find the best fit transfer function, generate Bode plots for each transfer function against the data, and find the best-fit mass, damping, and spring matrices for the flexure. To find the best fits, we are currently using the Optimization Toolbox in MATLAB with moderate success. We still have to adjust the cost function that is being minimized in order to get better fits to the data since sometimes the optimization routine reaches its lower bound and gives spring and damping coefficients of 0 for some transfer functions. |
|||
=Results= |
=Results= |
||
[[image:bode_plots_1.bmp|thumb|500px|Bode Plots]] |
|||
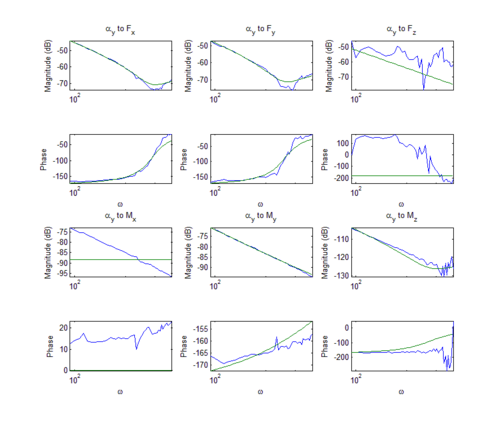
Due to the optimization inconsistencies, we have been able to find a full mass, damping, or spring matrix for a flexure. However other transfer functions are fitting very closely to the experimental data as can be seen in the figure to the right. These are the experimental Bode plots from rotational acceleration of 100 <math>rad/s^2</math> to each of the forces. Using the results from transfer functions that are fitting well, the spring coefficients for strongly connected motions are on the order of 1000 N/m (or N/rad) while uncoupled motions are much smaller at around 50 to 100 N/m. The damping coefficient for almost all of the "good" entries is around 0.7 Ns/m (or Ns/rad) and the masses are on the order of 30 grams, a reasonable number for the size and material of the flexure. Based on preliminary results, the damping of the flexures is relatively small and the spring coefficients are near the estimated value of 2000 N/m along the diagonal. |
|||
On a more qualitative note, when the flexures on the PPOD were changed from 1" of exposed tubing to 0.5", the PPOD responded much better than before. It was able to control in fewer updates and could control at higher amplitudes. One of the longer flexures had buckled, either due to the weight of the force sensor mount and C-clamps or failure due to fatigue. However, if the flexures are too short, then they will be too stiff and not allow enough motion. I believe there is an ideal length which we may be able to find with the flexure tester in the future. |
|||
Also we were able to take high-speed video of several flexure tests, which can be found on the [http://www.youtube.com/user/PPODshakin PPOD Youtube channel]. Looking at these we can confirm some of the results from the Bode plots. |
|||
*At lower frequencies, there is a lot more motion (and thus higher forces). |
|||
*As the motion increases, the response may become more non-linear since there is a lot of bending at the base of the flexure. |
|||
*Also, as amplitude is increases the response may be non-linear for the same reasons as above. |
|||
<br clear=all> |
|||
=Next Steps= |
=Next Steps= |
||
*The most important step is to tune the transfer function fitting program so we can fully characterize the flexures. |
|||
*The data output from the flexure test program only takes into account the force sensor readings at the input driving frequency. This is done to eliminate the high frequency noise from the sensor circuit but as a result we do not get all of the output response. In the future we would like to look at a power spectrum of the force sensor signal and analyze the harmonics of the driving frequency to see how much harmonic excitation exists in the system. |
|||
*We have only looked at a vertical flexure so far. After the transfer function fitting is working better we would like to characterize more shapes and lengths to see how the geometry affects the properties, starting with the current PPOD's flexures and the old PPOD's flexures. |
|||
*To see if there is non-linear behavior in the flexures, I would like to run frequency sweeps at a variety of amplitudes as well as a wider range of frequencies. |
|||
*The long term goal is to use the information gathered from these other exercises to design a new flexure to increase the performance of the PPOD, or any other system using flexures. This will most likely include finite element analysis, structural optimization, and CAD design so the flexure can be plastic injection molded, made on a rapid prototyping machine, or otherwise created. |
|||
Latest revision as of 08:08, 11 June 2009
Overview
Flexures are deformable solid bodies used to connect elements in a mechanical system. This flexibility allows for greater freedom of motion of the parts relative to each other than a rigid joint does, but at the cost of complicating the dynamics of the system. As one can imagine, it is important to know the properties of the flexures in order to predict and control the behavior of a system. This project is primarily focused on the flexures used in the PPOD projects in LIMS which are used to connect the linear actuators to the table. In this case the flexures allow the table to move in all six degrees of freedom (three translational and three rotational) which the use of rigid joints would not allow. The goals of this project are to be able to test the performance of the existing flexures and to use this information to design new ones to improve the performance of the PPOD. The flexures currently on the PPOD are made of a 1/4" Tygon tubing glued to aluminum mounts.
Hardware
There are three basic pieces of hardware needed to characterize a flexure: a forcing mechanism that can move in all six degrees of freedom, accelerameters to collect motion data, and a six-axis force sensor to collect the forces and moments. The PPOD is used to force the flexures because it already collects acceleration data of the plate and it can control motion in all six degrees of motion at frequencies and amplitudes at which the flexures will be used.
- Force Sensor mount - In order to attach the flexure and force sensor to the PPOD, we had to design a detachable mounting system. To make it light enough that the PPOD would not have much difficulty in controlling it, the arms were made from aluminum honeycomb and glued in the center to an aluminum plate where the force sensor attaches. This central plate is to make the mount more rigid as the arms are separate pieces. Three C-clamps are used to attach the mount to the PPOD plate, one at the end of each arm. The arms are aligned so that one arm points along the positive PPOD y-axis such that the force sensor cable is near the positive PPOD x-axis.
- Force Sensor - The force sensor used is an ATI Industrial Automation Mini 40 Force/Torque Sensor, model US-10-20. The data sheet can be directly seen here or found on ATI's website.
- Rigid Mount - The free end of the flexure must be mounted to a rigid body in order to measure the force the flexure is applying to the plate. This is currently a large T of steel that fits over the PPOD and the plate that the flexure is mounted to can be clamped to the bar. The height and position of the plate can be adjusted by adding spacers between the plate and the mount.
Data Collection
Data collection is relatively easy and is done through the Flexure_GUI shown below. This graphical user interface shows the controller information on the left side and the force sensor information the right.
- Flexure Frequency Response - This button starts the frequency test for a flexure. After the flexure is mounted and connected to the force sensor, and you have checked all the options, press this to begin. If this is the first test then the controller will ask to perform a frequency sweep, it is recommended to do so.
- Reset DAQ - This will reset the DAQ properties. Use this if the program is stopped before it finishes all of the frequency sweeps, this will reset the Sampling Data.
- Plate Motion - These are the important input parameters for flexure testing.
- f - A vector of frequencies to test the flexure at. The program sweeps through this range in one direction before moving on the to next direction. The range of usable frequencies depends on the amplitude, but for the default amplitude is 15 to 55 Hz. Above this and the controller will not be able to control plate motions.
- A - These are two vectors for the linear and angular accelerations of the plate, respectively. These have not been tested above default values for the range of usable frequencies.
- Sampling - Decreasing these will speed up computation time but may cause the program to crash if too low.
- Samples/second - Adjusts the number of samples per second. Maximum value for current DAQ hardware is around 10000 so it is recommended to stay with the default 9000.
- Transient cycles - Number of cycles to wait after a controller update before collecting data to allow for the transient response to die out.
- Logged cycles - Number of cycles to collect data. If this is increased you should also increase the transient and processing cycles to allow for the extra computation time.
- Computation cycles - Number of cycles to wait before the controller update to allow for computation time.
- Export handles - Exports the data structure with all of the information from the test. handles.flexureinfo has the tested frequencies and the complex number representing the transfer function. handles.plateinfo has the accelerations used in the test. This structure is used as the input to the flexure analysis programs found later. Save this in MATLAB using the command:
save('filename','handles')
- Force Signals - These six plots show the data collected from the force sensor during one period. The left column is for forces in the linear direction shown in N and the right column is for the moments about the coordinate axis in Nm. The high frequency noise is expected and this is filtered out by the program when it does computations.
- Controller Information - found on the left half
- Control Signals - These plots show the input voltage to each of the actuators over one period of the plate motion. Set the saturation voltage level using the text box in the central pane. Default is 4V and should never exceed 8V, especially for high amplitude driving.
- Plate Signals - These plots show the desired and actual plate motions over one period. The left column displays the linear accelerations in and the right column is the angular accelerations about the coordinate axes in . Adjust the "Max Number of Updates" box in the central pane to the allow the controller to have enough time to match the match the desired response at a given frequency.
- Highest Controller Harmonic - Adjust this so the controller will control the harmonics of the input frequencies. This can help get rid of noise and give better responses.
- Controller Gain - This is the gain of the controller. Increase this to increase the response of the controller, however this should not be increased along with the saturation voltage.
- Initial Control Signals - Adjust these for different initial guesses for the control signals.
- Previous signals - Takes the last used signals as the starting point for the next response it tries to control.
- Freq response based guesses - The controller will run a sweep of the input frequencies and their harmonics to make guesses for controller signals. This is the recommended setting and will generally control the fastest.
- Zeros - This starts the controller from nothing so it will take longer to find good controller values.
- ||e|| tolerance - The error tolerance. When the controller error drops below this number it means the response is "close enough" to the desired response that it can move on to the next response.
- Frequency Response - This allows the user to manually generate and view the frequency response of the system. Input a range of frequencies to test as well as the actuator voltage level to use during the sweep.
- Save Signals - This will save the controller signals, do this if the controller was working very well so it can start there later.
Transfer Function Fitting
Until now, only a simple approximation has been used to describe the flexures when modeling the system. In reality, a flexure will have a mass, damping, and spring matrix as well as more complicated non-linear behavior associated with it that maps its motion to the forces it applies. For now we have assumed a second-order system of the form:
Here is a vector of forces and moments and is a vector of coordinates. This leads to a transfer function from input acceleration to output force given by:
We then have to fit this model to each combination of the accelerations and forces for a total of 36 transfer functions, one for each entry in the mass, damping, and spring matrices. For this we used the MATLAB code found here. Read comments in the code for specific instructions on use.
Overall, this code will analyze the data output from the flexure test. It can be used to find the best fit transfer function, generate Bode plots for each transfer function against the data, and find the best-fit mass, damping, and spring matrices for the flexure. To find the best fits, we are currently using the Optimization Toolbox in MATLAB with moderate success. We still have to adjust the cost function that is being minimized in order to get better fits to the data since sometimes the optimization routine reaches its lower bound and gives spring and damping coefficients of 0 for some transfer functions.
Results
Due to the optimization inconsistencies, we have been able to find a full mass, damping, or spring matrix for a flexure. However other transfer functions are fitting very closely to the experimental data as can be seen in the figure to the right. These are the experimental Bode plots from rotational acceleration of 100 to each of the forces. Using the results from transfer functions that are fitting well, the spring coefficients for strongly connected motions are on the order of 1000 N/m (or N/rad) while uncoupled motions are much smaller at around 50 to 100 N/m. The damping coefficient for almost all of the "good" entries is around 0.7 Ns/m (or Ns/rad) and the masses are on the order of 30 grams, a reasonable number for the size and material of the flexure. Based on preliminary results, the damping of the flexures is relatively small and the spring coefficients are near the estimated value of 2000 N/m along the diagonal.
On a more qualitative note, when the flexures on the PPOD were changed from 1" of exposed tubing to 0.5", the PPOD responded much better than before. It was able to control in fewer updates and could control at higher amplitudes. One of the longer flexures had buckled, either due to the weight of the force sensor mount and C-clamps or failure due to fatigue. However, if the flexures are too short, then they will be too stiff and not allow enough motion. I believe there is an ideal length which we may be able to find with the flexure tester in the future.
Also we were able to take high-speed video of several flexure tests, which can be found on the PPOD Youtube channel. Looking at these we can confirm some of the results from the Bode plots.
- At lower frequencies, there is a lot more motion (and thus higher forces).
- As the motion increases, the response may become more non-linear since there is a lot of bending at the base of the flexure.
- Also, as amplitude is increases the response may be non-linear for the same reasons as above.
Next Steps
- The most important step is to tune the transfer function fitting program so we can fully characterize the flexures.
- The data output from the flexure test program only takes into account the force sensor readings at the input driving frequency. This is done to eliminate the high frequency noise from the sensor circuit but as a result we do not get all of the output response. In the future we would like to look at a power spectrum of the force sensor signal and analyze the harmonics of the driving frequency to see how much harmonic excitation exists in the system.
- We have only looked at a vertical flexure so far. After the transfer function fitting is working better we would like to characterize more shapes and lengths to see how the geometry affects the properties, starting with the current PPOD's flexures and the old PPOD's flexures.
- To see if there is non-linear behavior in the flexures, I would like to run frequency sweeps at a variety of amplitudes as well as a wider range of frequencies.
- The long term goal is to use the information gathered from these other exercises to design a new flexure to increase the performance of the PPOD, or any other system using flexures. This will most likely include finite element analysis, structural optimization, and CAD design so the flexure can be plastic injection molded, made on a rapid prototyping machine, or otherwise created.


![{\displaystyle {\overrightarrow {f}}=[f_{x},f_{y},f_{z},M_{x},M_{y},M_{z}]^{T}}](https://wikimedia.org/api/rest_v1/media/math/render/svg/8aec2a071c50484c3c98fe088fee5c7a0d242a1d)
![{\displaystyle {\overrightarrow {x}}=[x_{x},x_{y},x_{z},\theta _{x},\theta _{y},\theta _{z}]^{T}}](https://wikimedia.org/api/rest_v1/media/math/render/svg/96b893c58d9f3cbbbeb0af57626b7551316a9b12)


