Difference between revisions of "PPOD User Guide"
Philip Dames (talk | contribs) |
Philip Dames (talk | contribs) |
||
| Line 45: | Line 45: | ||
<br clear=all> |
<br clear=all> |
||
| ⚫ | * Importing Data - First, select the parameters that you would like the program to fit to the data. If any of the boxes are unchecked then another GUI will appear prompting the user to input the actual values. Leaving an entry as NaN will fit that parameter, Zeros will set all values to 0, Import allows you to import the values from a previous fit, and Done accepts the values and continues the program. To begin, press the Import Data button in the bottom center of the screen. |
||
== Importing Data == |
|||
| ⚫ | * Plot Options - On the left side of the GUI, there are several options for the user. There are two types of plots: FFT and Bode plots. More details about these can be found below. The y-scale can either be linear (Force in Newtons) or logarithmic (dB). The frequency can either be in Hz or rad/s. The other options are for changing the inputs/outputs being plotted. The upper box is for a single input to all of the outputs and the lower box is for all of the inputs to a single output. |
||
| ⚫ | First, select the parameters that you would like the program to fit to the data. If any of the boxes are unchecked then another GUI will appear prompting the user to input the actual values. Leaving an entry as NaN will fit that parameter, Zeros will set all values to 0, Import allows you to import the values from a previous fit, and Done accepts the values and continues the program. To begin, press the Import Data button in the bottom center of the screen. |
||
| ⚫ | * FFT Plots - This option displays the fast Fourier transform of the chosen input/output signals on the upper row of plots, with a legend showing the frequencies in the lower left plot. The options for the FFT plots are found in the lower left corner. Users can select the frequencies to plot as well as the number of harmonics of each frequency to plot. The x-scale can be switched between harmonic and actual frequency. Ideally all harmonics that are not the first should be zero. |
||
== Plot Options == |
|||
| ⚫ | |||
| ⚫ | On the left side of the GUI, there are several options for the user. There are two types of plots: FFT and Bode plots. More details about these can be found below. The y-scale can either be linear (Force in Newtons) or logarithmic (dB). The frequency can either be in Hz or rad/s. The other options are for changing the inputs/outputs being plotted. The upper box is for a single input to all of the outputs and the lower box is for all of the inputs to a single output. |
||
| ⚫ | |||
== FFT Plots == |
|||
| ⚫ | |||
| ⚫ | This option displays the fast Fourier transform of the chosen input/output signals on the upper row of plots, with a legend showing the frequencies in the lower left plot. The options for the FFT plots are found in the lower left corner. Users can select the frequencies to plot as well as the number of harmonics of each frequency to plot. The x-scale can be switched between harmonic and actual frequency. Ideally all harmonics that are not the first should be zero. |
||
== Bode Plots == |
|||
| ⚫ | |||
== Export Options == |
|||
| ⚫ | |||
== Flexure Parameters == |
|||
| ⚫ | |||
= Troubleshooting = |
= Troubleshooting = |
||
Revision as of 12:43, 10 September 2009
This article outlines the setup and use of the 6 DoF PPOD for part manipulation and flexure testing, as well as analysis of flexure test results.
DAQ Info
PCI Cards
For all uses of the 6 DoF PPOD the computer should have the National Instruments PCI-6224 input DAQ card and the National Instruments PCI-6713 output DAQ card. The installed National Instruments DAQ cards can be checked using the MATLAB command:
daqhwinfo('nidaq')
Calling this with no argument outputs a structure with all of the available DAQ hardware:
daqhwinfo
DAQ Board
The output card connects to the lower left socket in the photo above. The input card has two ribbon cables that connect to the other two sockets along the bottom: the upper cable on the PCI card connects to the right socket (channels AI0:AI15) and the lower cable connects to the middle socket (channels AI16:AI31).
The ribbon cable socket along the right edge connects to the accelerometer/speaker board, providing power and accelerometer readings.
The D-Sub socket in the upper right corner is for the force sensor used in flexure testing experiments. The switches above the screw terminals should both be to the left.
The power socket is on the left edge with the power switch found directly below it. The six speaker outputs are found along the top with speaker 1 on the far left and speaker 6 on the right.
All screw terminals should be empty during normal use (with the exception of channels 16:17 and 24:25 which can be used at any time). The input channels can also be used to read in signals from the screw terminals found above the lower sockets. To read in from the screw terminals for channels 0:15, unplug the ribbon cable leading to the accelerometer board. To read channels 18:23, slide the right switch found above the screw terminals to the right. The same goes for channels 26:31 with the left switch.
Part Manipulation
For part manipulation the force sensor should be unplugged as it adds a small amount of noise to the other signals in the system.
Flexure Testing
Flexure Analysis
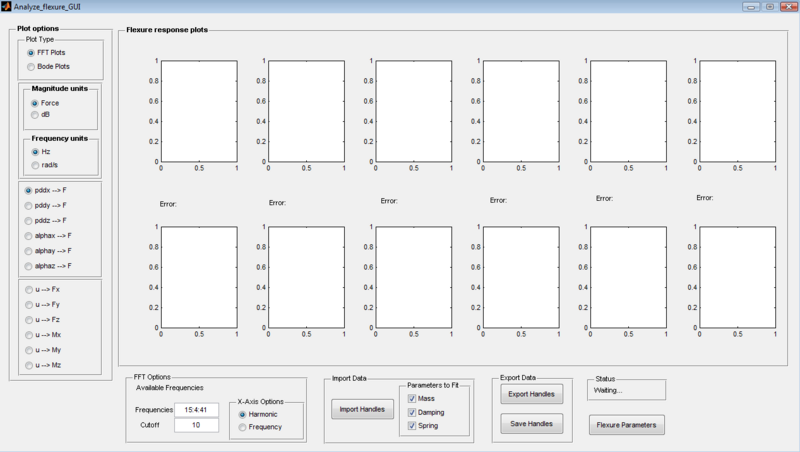
- Importing Data - First, select the parameters that you would like the program to fit to the data. If any of the boxes are unchecked then another GUI will appear prompting the user to input the actual values. Leaving an entry as NaN will fit that parameter, Zeros will set all values to 0, Import allows you to import the values from a previous fit, and Done accepts the values and continues the program. To begin, press the Import Data button in the bottom center of the screen.
- Plot Options - On the left side of the GUI, there are several options for the user. There are two types of plots: FFT and Bode plots. More details about these can be found below. The y-scale can either be linear (Force in Newtons) or logarithmic (dB). The frequency can either be in Hz or rad/s. The other options are for changing the inputs/outputs being plotted. The upper box is for a single input to all of the outputs and the lower box is for all of the inputs to a single output.
- FFT Plots - This option displays the fast Fourier transform of the chosen input/output signals on the upper row of plots, with a legend showing the frequencies in the lower left plot. The options for the FFT plots are found in the lower left corner. Users can select the frequencies to plot as well as the number of harmonics of each frequency to plot. The x-scale can be switched between harmonic and actual frequency. Ideally all harmonics that are not the first should be zero.
- Bode Plots - This option displays the Bode plots of the chosen input/output signal. Each plot shows the data as points and the best fit model as a solid line.
- Export Options - Export Handles will save the handles structure to the base MATLAB workspace. Save Handles will save the handles structure to a .mat file in the location chosen.
- Flexure Parameters - This button opens a new window displaying the fit (or input) mass, damping, and spring coefficients for the flexure being tested. The button at the bottom of the window saves the three matrices to the base MATLAB workspace.
Troubleshooting
If the PPOD is not performing properly, the following steps should followed to ensure everything is set up correctly.
Power
If the control/accleration signals are zero or the plate is having difficulty controlling then there may be a problem with the power. Ensure all of the amplifiers and the DAQ board are turned on and have power. Check to see if all the amplifiers are set to the same gain (+8 dB has been found to work well, though any value that will not overload the actuators should work).
Mechanical Connections
If one or two control signals are saturating, or the PPOD is rattling then there may be a problem with the mechanical connections. Manually inspect the flexures for signs of buckling, kinking, or misalignment. If necessary, replace damaged felxures using Tygon tubing and metal bonding epoxy. When changing flexures, sometimes it is necessary to rotate an actuator slightly to keep the flexure aligned. To do this, loosen the bolts found on the underside of the base below the desired actuator. Check the set screws on the plate and actuators that hold the flexures in place. Check the springs to make sure they are tensioned approximately evenly.
DAQ Initialization
If the PPOD will not function at all or the signals do not match the plate motions then there may be a problem with the DAQ initialization/setup in MATLAB. The BoardNames match up with the respective InstalledBoardIds in the output structure. If the PPOD does not work, ensure that the DAQ objects were initialized properly by comparing the 'DevX' from above with the handles.daqinfo.ai and handles.daqinfo.ao object in the Initializedaqinfo.m file, set in lines 25-26. Output channels should be 0:6 (0 is the clock pulse, 1:6 are speaker channels) set in line 36. Input channels should be 0:11 (for the 12 accelerometer signals) set in line 39.
Speaker/Accelerometer Connections
If one or more signals are zero, or the signals do not match the plate motions then there may be a problem with the speaker/accelerometer connections. Check the connections on the back on the amplifiers. CH 1 input corresponds to Channel A output, and CH 2 with Channel B. Ex. Channel 1 leading out from the DAQ board should connect to CH 1 of the bottom amplifier and the leading out of Channel A should connect to the screw terminal labeled Speaker 1 on the accelerometer board. Accelerometer 1 should be found above Speaker 1, Accelerometer 2 should be found above Speaker 2, etc on the PPOD. The pins on the accelerometers plug into the holes on the ribbon cable sockets that are closest to the end of the cable. Check the MATLAB function L2Wconverter.m to ensure that the accelerometer locations in the function correspond to the actual locations on the plate.
Other
These steps should solve most problems encountered during normal use of the PPOD. If problems persist, it may require a more in-depth examination of the code and/or physical setup.


