NUScope
The nuScope is a PIC32 based oscilloscope and function generator. For previous versions, please see NUScope 2011.
It has the following abilities:
- bipolar power supply, providing +5v and -5v at up to 100mA
- 2-channel analog oscilloscope with 10-bit resolution
- 4-channel digital oscilloscope
- function generator and digital output
How to Use the nuScope
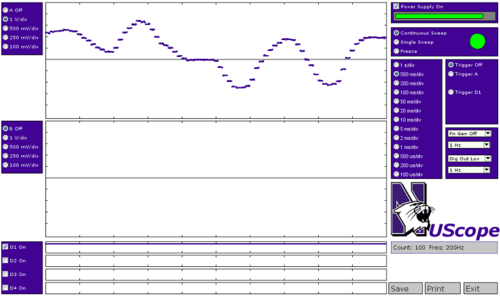
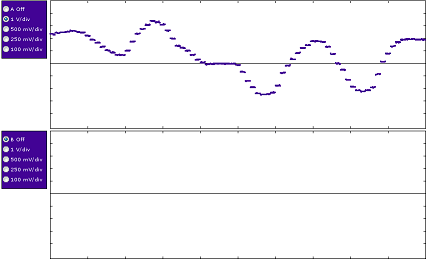
Analog oscilloscope There are two analog oscilloscope channels. These are the Analog A and Analog B traces. Using the radio buttons to the left of the trace, you can adjust the sensitivity of each channel between 1 volt/division (+5 to -5 volts full scale) and 100mV/division. The "divisions" are the gray tick marks on the vertical axis, shown below. Note: The analog channels don't work when the power supply is disabled.
Digital oscilloscope There are five digital oscilloscope channels. Four of the channels are inputs, D1 - D4. do is a digital output, discussed below.
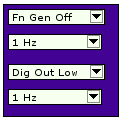
Function generator There is one function generator output, Fn, discussed below.
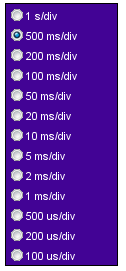
Sweep speeds The sweep speed can be adjusted between 1 second/division and 1 microsecond/division. In the trace display there are 10 divisions horizontally, indicated by the gray tick marks.
Sweep modes Sweeps can run continuously, or you can freeze one sweep. You can select Continuous or Freeze modes using the radio buttons (as shown below). Each time you click Single Sweep (or type S) one new sweep will be displayed, and then frozen.
The "sweep dot" blinks green when sweep data is received from the scope hardware, and otherwise it is red while waiting for data (see above image).
You can save a screenshot of the software by pressing the Print button.
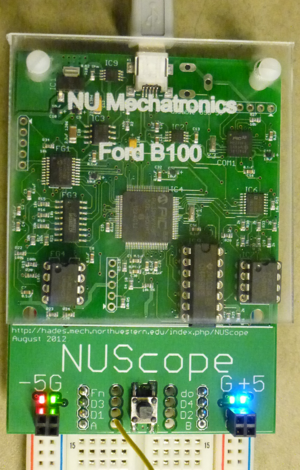
Power supply The nuScope unit provides power supply "rail" voltages for your circuits: +5V and -5V with respect to ground, at up to about 100mA. Blue and red LEDs indicate the +5V and -5V rails; green LEDs indicate the G (ground) rails. The color stripes on your solderless breadboard won't necessarily correspond to the LED colors; trust the LEDs. The LED colors tell you which supply voltage each rail carries.
A pushbutton toggles the power supply on and off. If you exceed the current capability of the supply, it will turn off (red and blue LEDs will go out and the green LEDs will alternately flash). You can reset it with the pushbutton, unless it is is still overloaded.
A bar graph shows the power consumption of the DCDC converter used to produce the rail voltages. When the power consumption becomes excessive, and before the DCDC converter overheats or the computer shuts off USB power, the power supply will be turned off.
Plugging in to a solderless breadboard
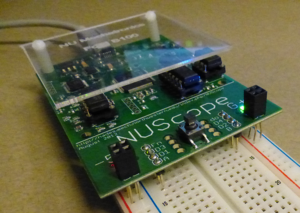
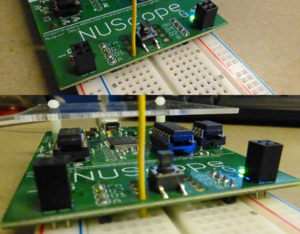
Plug your nuScope unit into solderless breadboard towards one end, to maximize the working space you have left but still fit into your supply box. It's best if you get the red-striped edge of the breadboard at the left as shown in the photo, even though this may make the numbering on the breadboard upside down. +5V, -5V, and ground prongs from the nuScope connect to the power supply rails of the breadboard (the holes that have a stripe by them). Input connections to the scope (silver in the photo) connect to testpoints that you can access, via the breadboard. You can connect signals from your circuit to the A and B analog inputs, to be displayed on your laptop, by pushing wires through the holes in the nuScope board and into the breadboard. See the wires in the photo below.
Installing the app
- The nuScope is designed to work with out drivers! When you first plug it in, you may see a pop-up recognizing the nuScope. For Mac, Windows, and Linux!
- Next you need the nuScope app for your platform. Download and install the NUScope ap (v3-6 will work with BME307 firmware) (Older versions: (v3-3 with triggering and function generator) (v3-1) (v3-0) )
- Did you remember to plug the board in before you launched the app?
- Note: If you have any problems getting your scope to work, email Nick immediately!
If everything works, you should see a moving trace, or, if the power supply is off, you will see a red "flat line" graph instead.
Data Acquisition
- Download and install version 3-4 of the NUScope ap to use the NUScope like a DAQ (v3-4 DAQ)
- Data is saved to the NUScope_2012 folder in a file called 'positions.txt'. The data appear in columns as:
- index A B D1 D2 D3 D4
- It is up to you to remember how fast the data was sampled and at what sensitivity!
- You can view the data in MATLAB by navigating to the NUScope_2012 folder, and using something like:
- a=load('positions.txt');plot(a(:,1),a(:,2), '.');
NUScope PONG
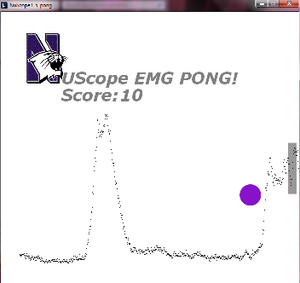
- Download and install version 3-5 of the NUScope app to use the NUScope to play PONG! (v3-5 PONG)
- The input to the game is 0-5V on channel A.
Testing your nuScope
- Cut and strip the ends of a wire and place it across A and 5V, then A and -5V, and then A and ground. The trace in the A graph should move accordingly.
Additional Information
Source code for the Processing app is in the NNScope_2012 folder.
